Free Access
Fig. 9.
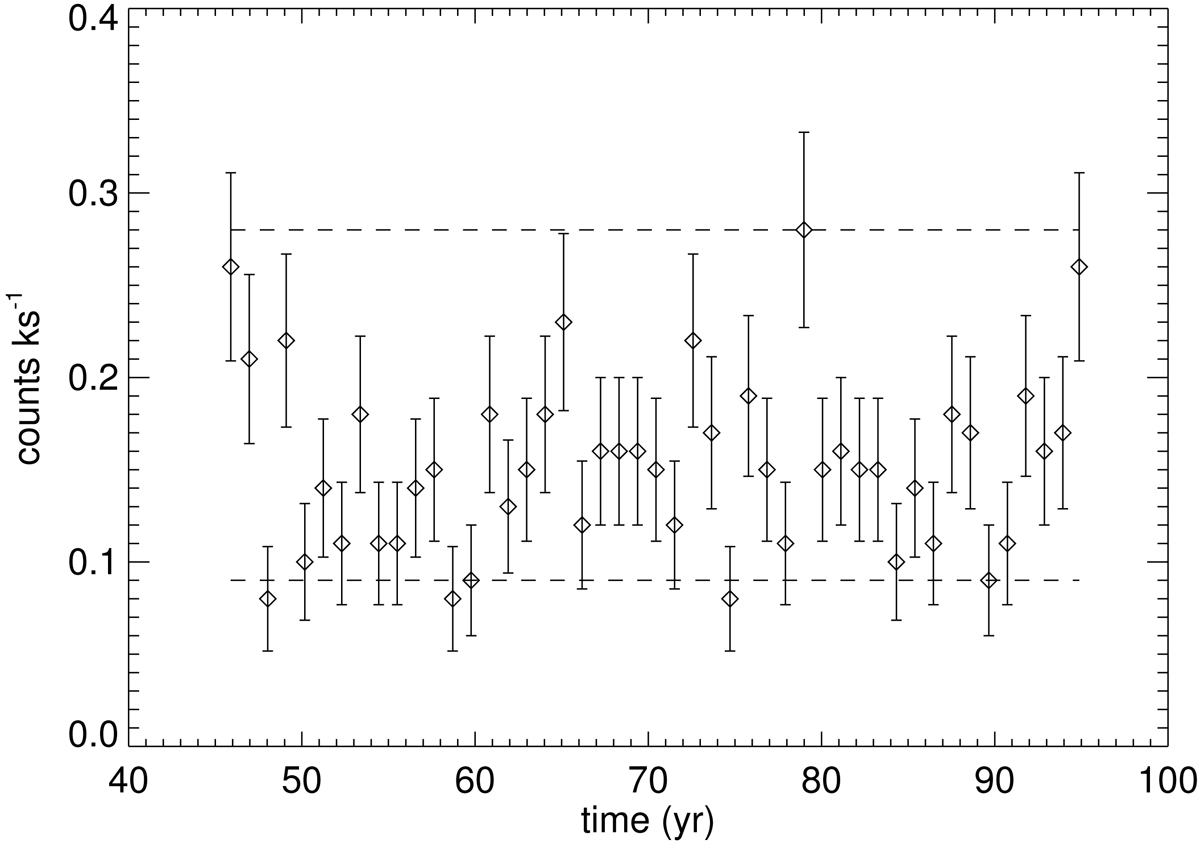
X-ray count rate in the [0.5–1] keV band with error bars for model HJ3. We plot one point every year. The dashed lines indicate the interval of the count rate observed for the DG Tau jet. A different scale is used for the y-axis with respect to Fig. 6.
Current usage metrics show cumulative count of Article Views (full-text article views including HTML views, PDF and ePub downloads, according to the available data) and Abstracts Views on Vision4Press platform.
Data correspond to usage on the plateform after 2015. The current usage metrics is available 48-96 hours after online publication and is updated daily on week days.
Initial download of the metrics may take a while.