Fig. 12.
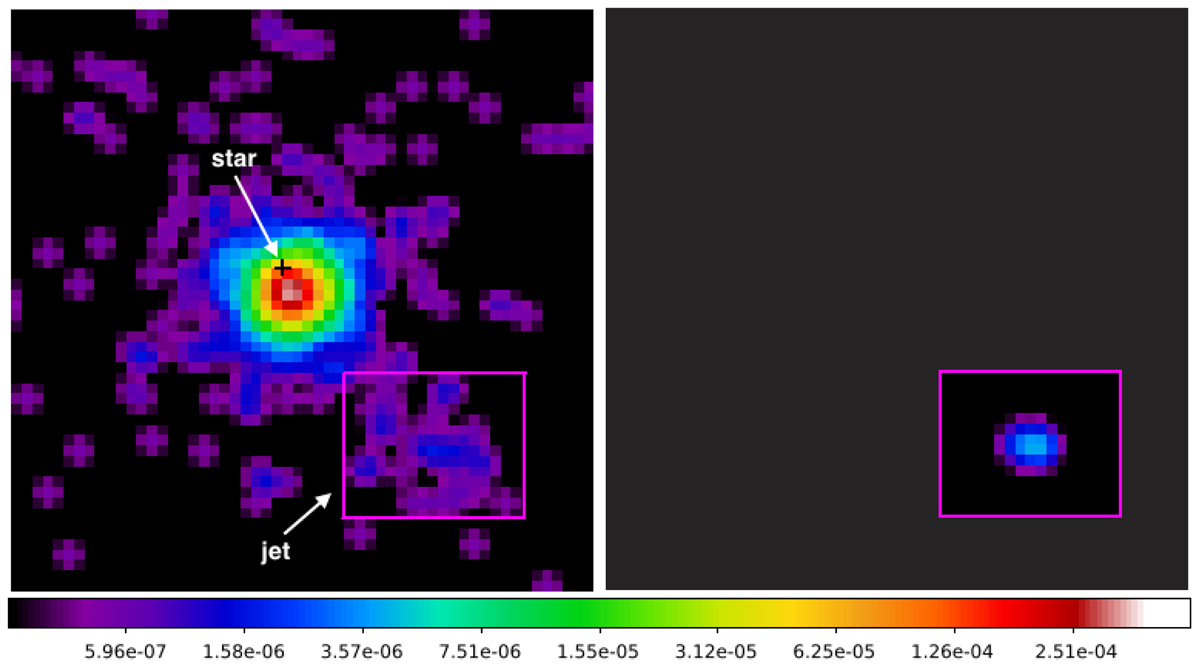
Smoothed X-ray count rate maps in the [0.5–1] keV band for DG Tau in logarithmic scale and with a pixel size of 0.25″. Left: 2010 data set resampled using the EDSER technique, as explained in Appendix A. We marked the position of the star with a cross and the SW jet with a box. Right: Synthetic image of the base of the jet as derived from model HJ3 at t = 70 yr (see lower right panel in Fig. 7), rebinned to match the same pixel size and convolved with the specific PSF. The modelled region is marked with a box corresponding to the SW jet. The angular size of each panel is ≈14″×14″ (a different scale to that used in Fig. 11). In each panel north is up and east is left. Gaussian smoothing was applied on the images with kernel of width 0.5″.
Current usage metrics show cumulative count of Article Views (full-text article views including HTML views, PDF and ePub downloads, according to the available data) and Abstracts Views on Vision4Press platform.
Data correspond to usage on the plateform after 2015. The current usage metrics is available 48-96 hours after online publication and is updated daily on week days.
Initial download of the metrics may take a while.