Fig. 1.
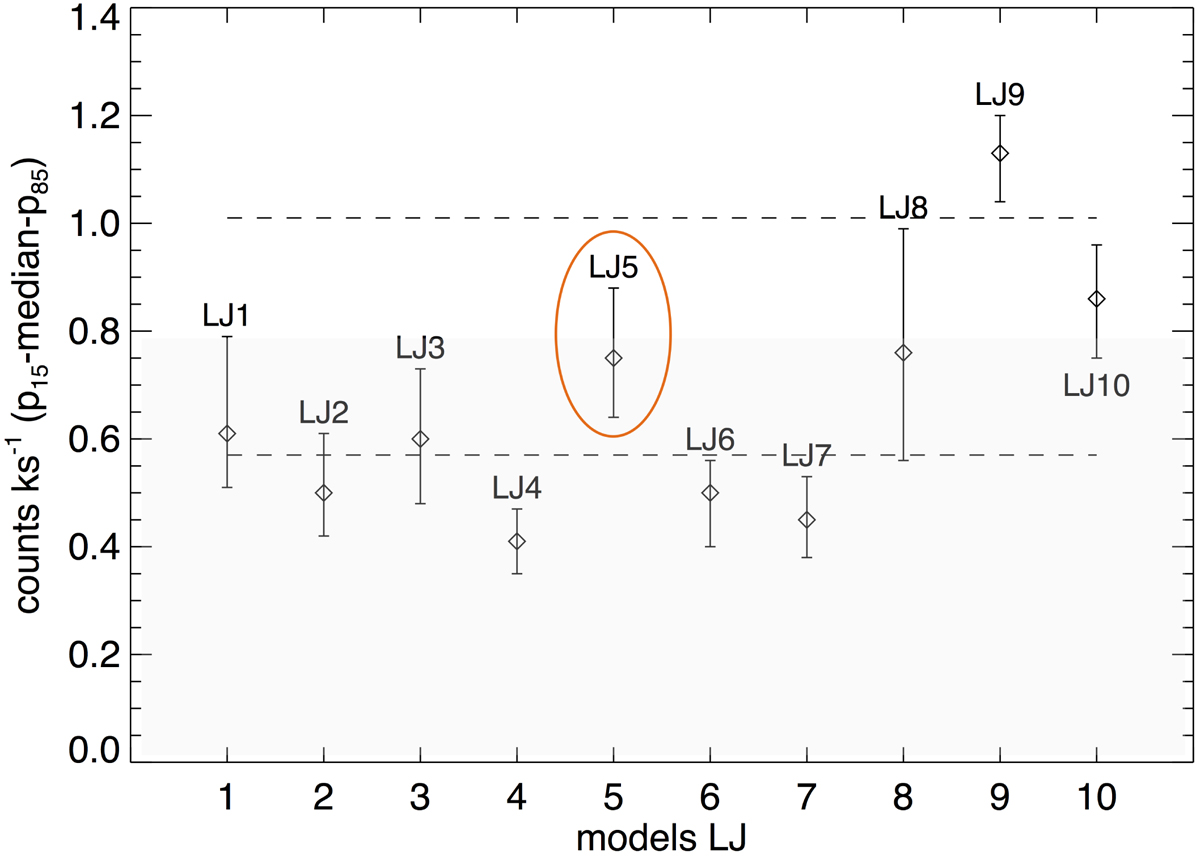
X-ray count rate in the [0.3–4] keV band of light jet models, named in the horizontal axis as described in Table 1. In the vertical axis we plot the median count rate in every case (represented with a diamond). The lower and upper error bars indicate the 15th and 85th percentile, respectively. The dashed lines indicate the interval of the count rate observed for HH 154. The orange circle indicates the reference case. The shadowed part corresponds to the scale of Fig. 6, which summarizes the heavy jet models described in the next subsection.
Current usage metrics show cumulative count of Article Views (full-text article views including HTML views, PDF and ePub downloads, according to the available data) and Abstracts Views on Vision4Press platform.
Data correspond to usage on the plateform after 2015. The current usage metrics is available 48-96 hours after online publication and is updated daily on week days.
Initial download of the metrics may take a while.