Fig. 3
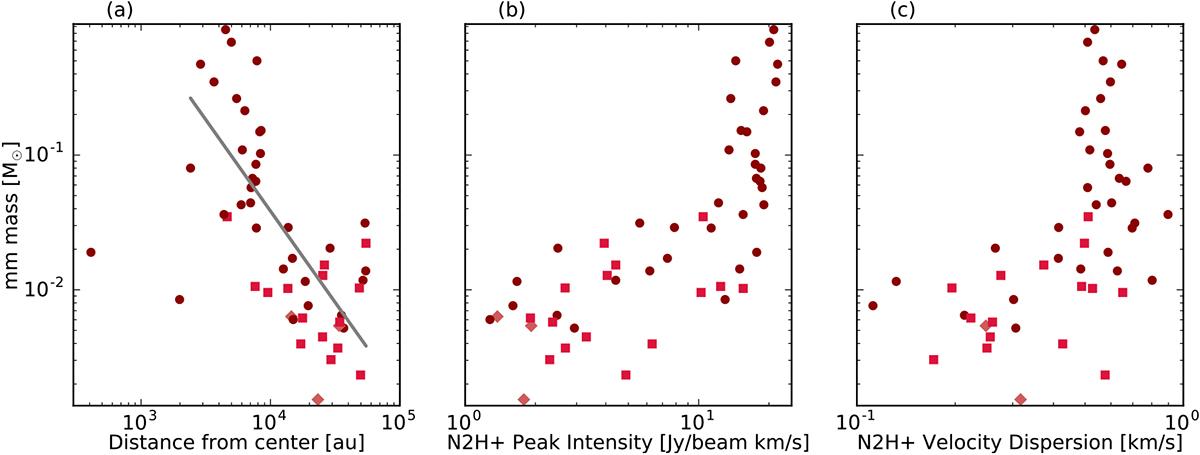
a) Millimeter mass vs. distance from “center”. We mark mm sources with no IR counterpart with dark red circles; Class 0/I protostar candidates with red squares; and flat-spectrum SED sources with light red diamonds. The best fit power-law (gray line) has an index of − 1.4 ± 0.2. We note that to perform this power-law fit, we removed the two sources with distances d < 2000 au from the center (points in the lower left). The “center” refers to the plus-sign in Fig. 1, and is discussed in Sect. 4.1. b) Mass vs. N2 H+ integrated intensity. c) Mass vs. N2H+ velocity dispersion. Here “mass” refers to mass of dust and gas based on 1.3 mm continuum emission and the calculation described in Sect. 3.3. N2 H+ integrated intensity and velocity dispersion are measured at each position given in Table A.1.
Current usage metrics show cumulative count of Article Views (full-text article views including HTML views, PDF and ePub downloads, according to the available data) and Abstracts Views on Vision4Press platform.
Data correspond to usage on the plateform after 2015. The current usage metrics is available 48-96 hours after online publication and is updated daily on week days.
Initial download of the metrics may take a while.