Fig. 8
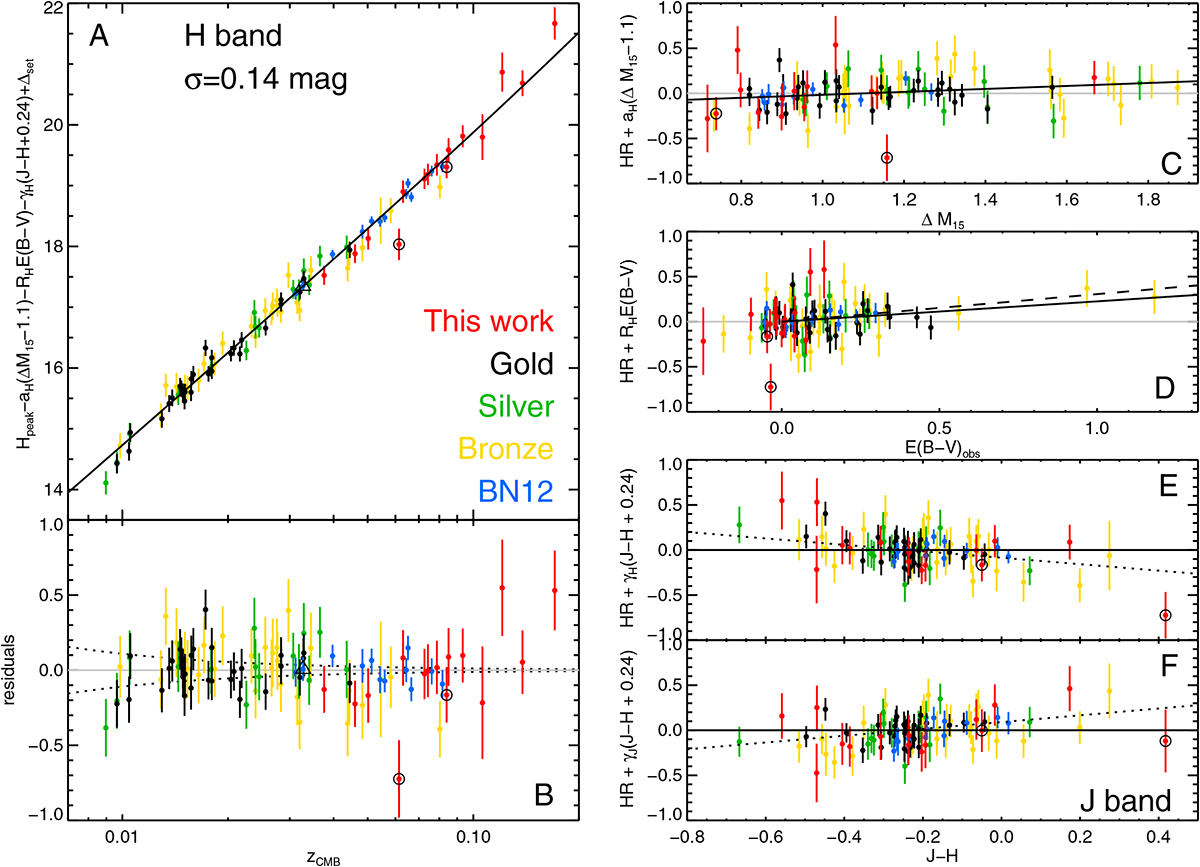
H-band Hubble diagram for the full sample with the aH and RH correction terms included. Panels c and d show the Hubble residuals when only aH or RH terms are applied vs. the quantity multiplied by the other, for example, in panel d the Hubble residuals vs.
![]() when only the aH correction term is applied. Panels e and f show H and J band residuals vs. Jmax − Hmax color. In panel d the dashed lines are the extinction corrections for Milky Way extinction law with RV = 1.7. The two red points surrounded by black circles are SN 2008bz and SNF20080512-008, which have been excluded from the fit (see text). The blue point surrounded a black triangle is PTF10hmv, which was observed only in H.
when only the aH correction term is applied. Panels e and f show H and J band residuals vs. Jmax − Hmax color. In panel d the dashed lines are the extinction corrections for Milky Way extinction law with RV = 1.7. The two red points surrounded by black circles are SN 2008bz and SNF20080512-008, which have been excluded from the fit (see text). The blue point surrounded a black triangle is PTF10hmv, which was observed only in H.
Current usage metrics show cumulative count of Article Views (full-text article views including HTML views, PDF and ePub downloads, according to the available data) and Abstracts Views on Vision4Press platform.
Data correspond to usage on the plateform after 2015. The current usage metrics is available 48-96 hours after online publication and is updated daily on week days.
Initial download of the metrics may take a while.