Free Access
Fig. 6
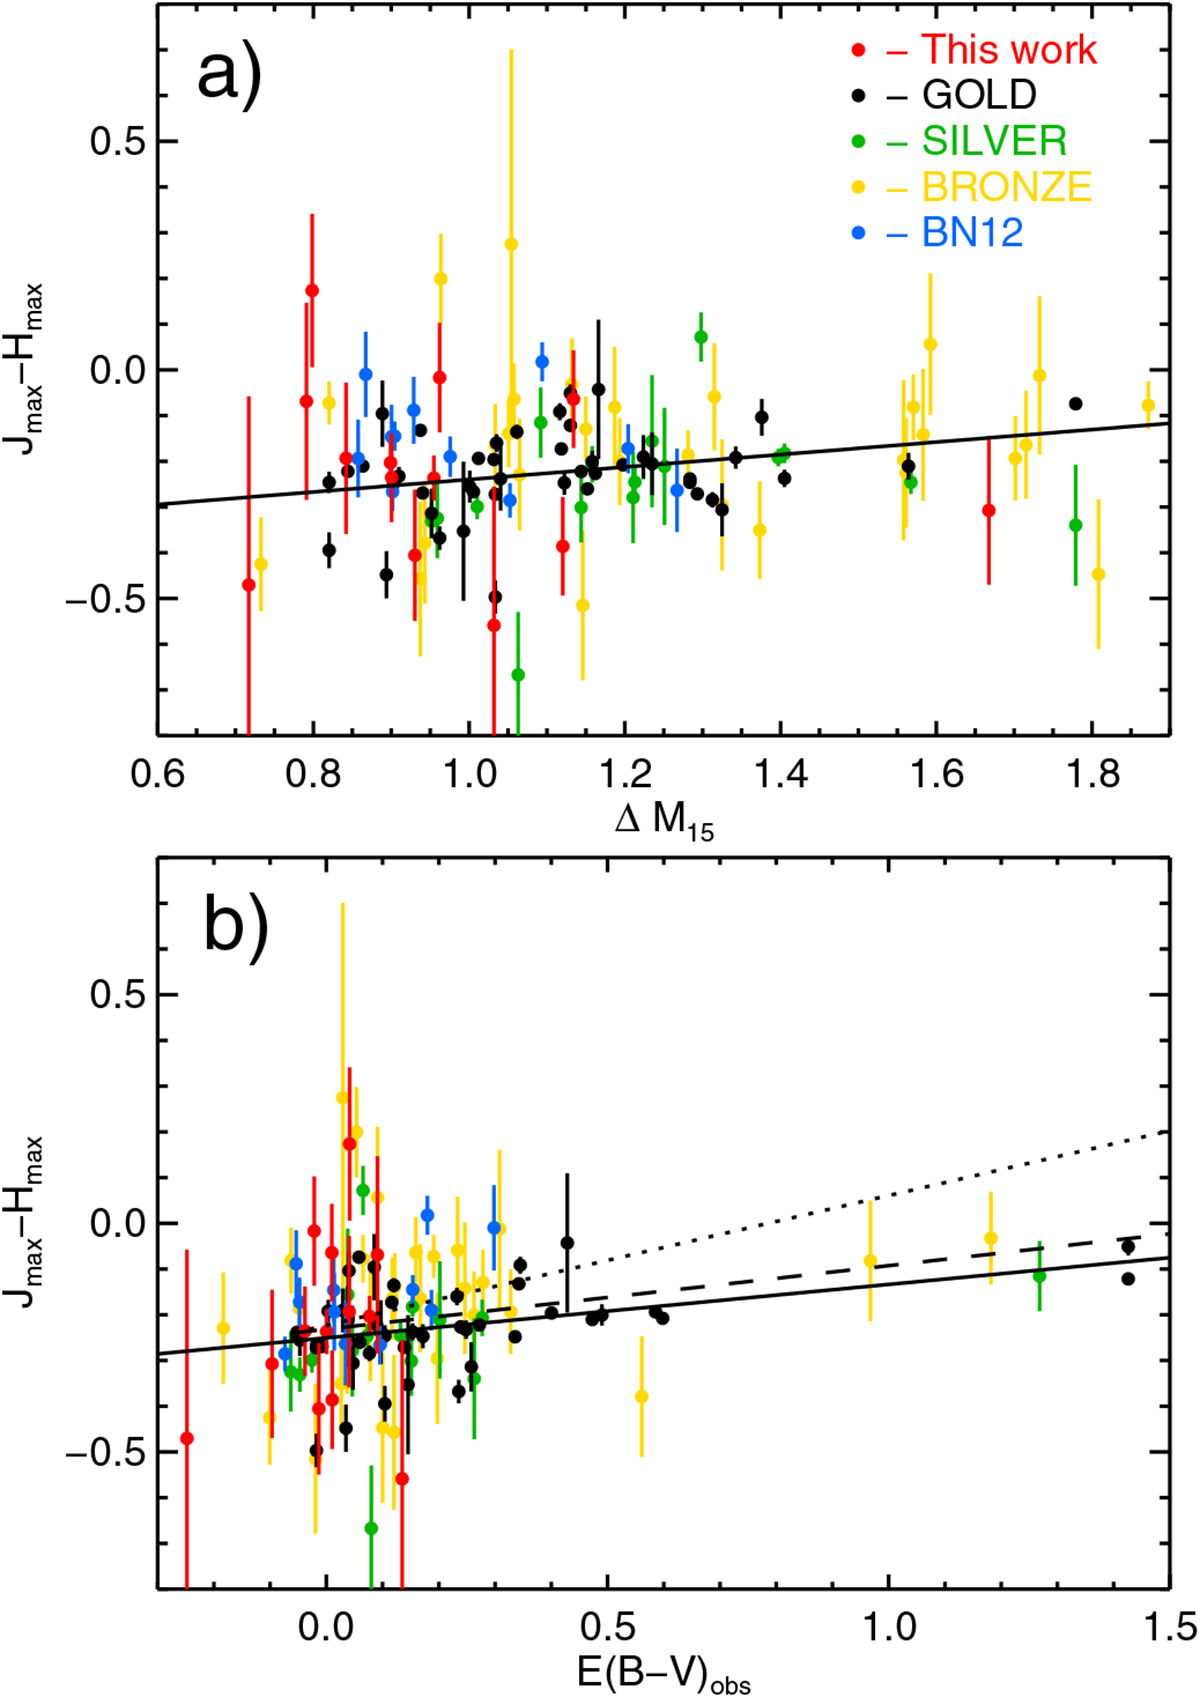
Panel a: Jmax − Hmax
color vs. ΔM15. The solid line shows the least-squares linear fit to the GOLD sample; panel b:
Jmax − Hmax
![]() . The solid line is the least-squares linear fit to the GOLD sample, the dashed and the dotted lines are the expected relation for Milky Way-type dust and RV = 1.7 and 3.1, respectively.
. The solid line is the least-squares linear fit to the GOLD sample, the dashed and the dotted lines are the expected relation for Milky Way-type dust and RV = 1.7 and 3.1, respectively.
Current usage metrics show cumulative count of Article Views (full-text article views including HTML views, PDF and ePub downloads, according to the available data) and Abstracts Views on Vision4Press platform.
Data correspond to usage on the plateform after 2015. The current usage metrics is available 48-96 hours after online publication and is updated daily on week days.
Initial download of the metrics may take a while.