Fig. E.3
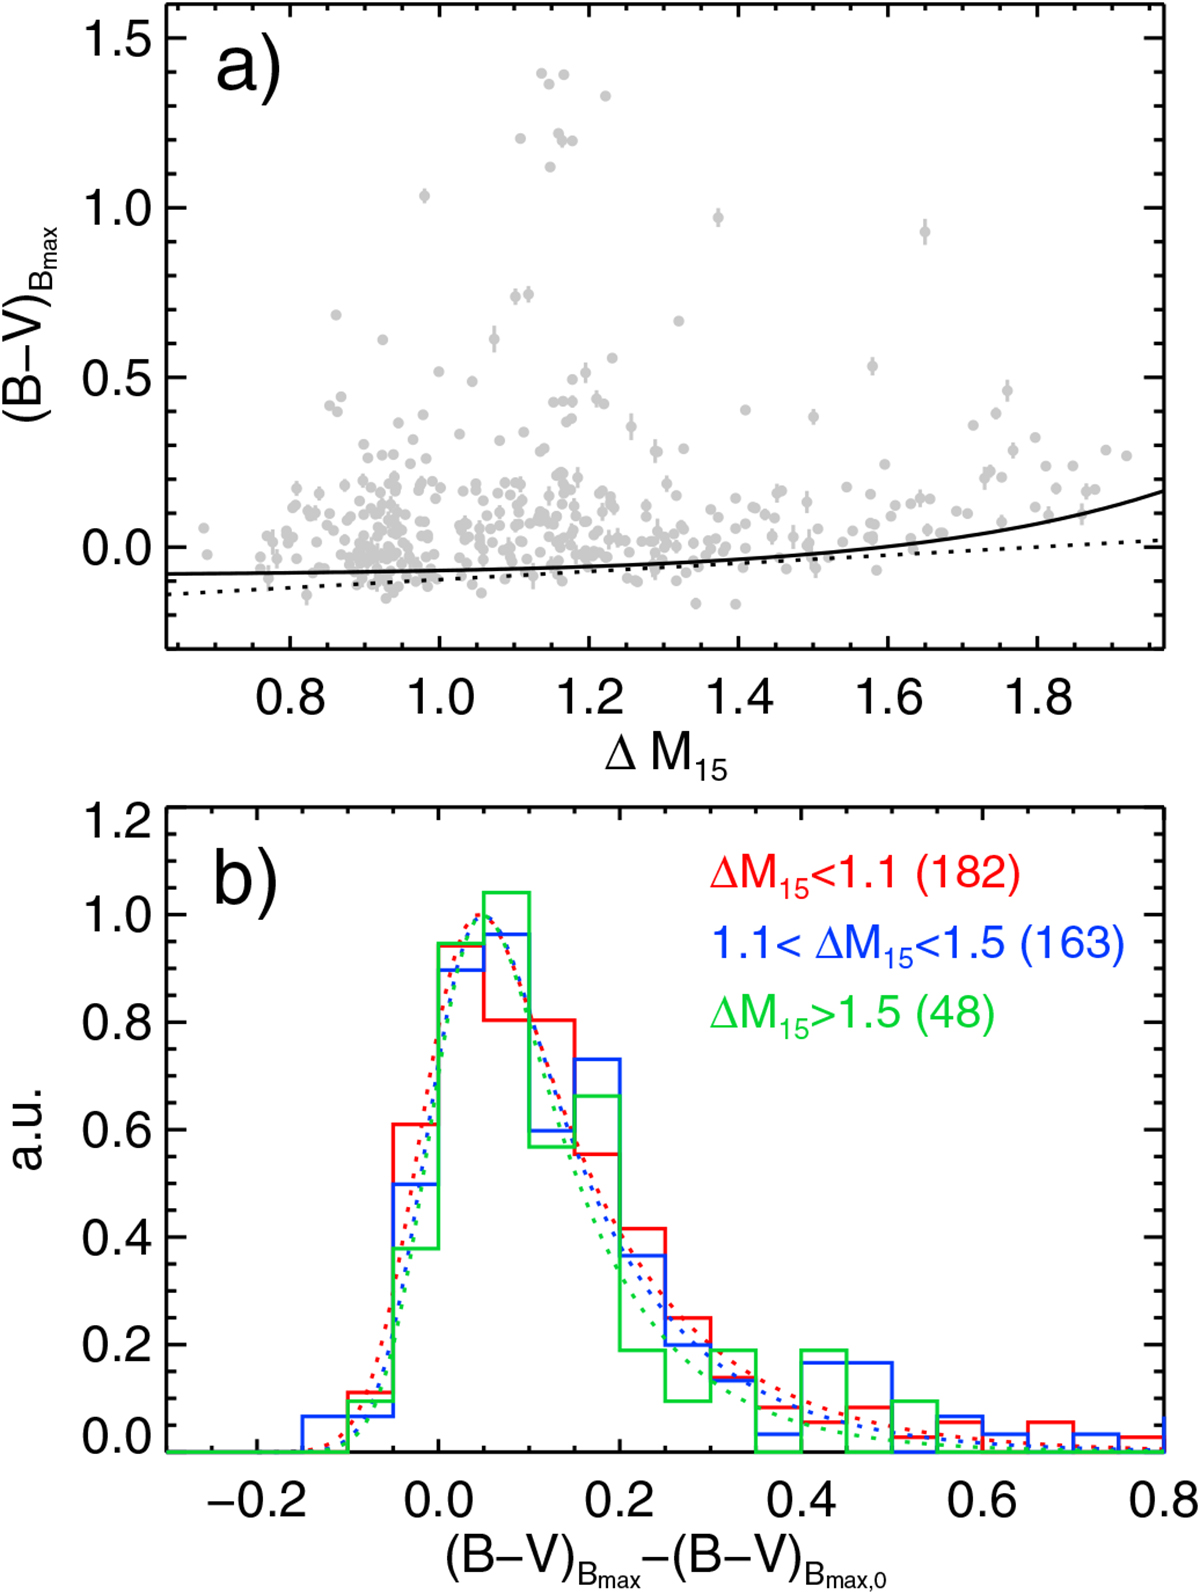
Panel a: ![]() color of the SNe used in this work as function of Δ M15. The solid line shows the relation defined by Eq. (F.2). The dashed line has a slope of 0.12 and is shown for a comparison; panel b: Histograms of
color of the SNe used in this work as function of Δ M15. The solid line shows the relation defined by Eq. (F.2). The dashed line has a slope of 0.12 and is shown for a comparison; panel b: Histograms of ![]() for SNe with ΔM15 < 1.1 (182 objects), 1.1 < ΔM15 < 1.3 (163 objects) and ΔM15 > 1.5 (48 objects) with the corresponding fits with Eq. (F.1).
for SNe with ΔM15 < 1.1 (182 objects), 1.1 < ΔM15 < 1.3 (163 objects) and ΔM15 > 1.5 (48 objects) with the corresponding fits with Eq. (F.1).
Current usage metrics show cumulative count of Article Views (full-text article views including HTML views, PDF and ePub downloads, according to the available data) and Abstracts Views on Vision4Press platform.
Data correspond to usage on the plateform after 2015. The current usage metrics is available 48-96 hours after online publication and is updated daily on week days.
Initial download of the metrics may take a while.