Fig. 1
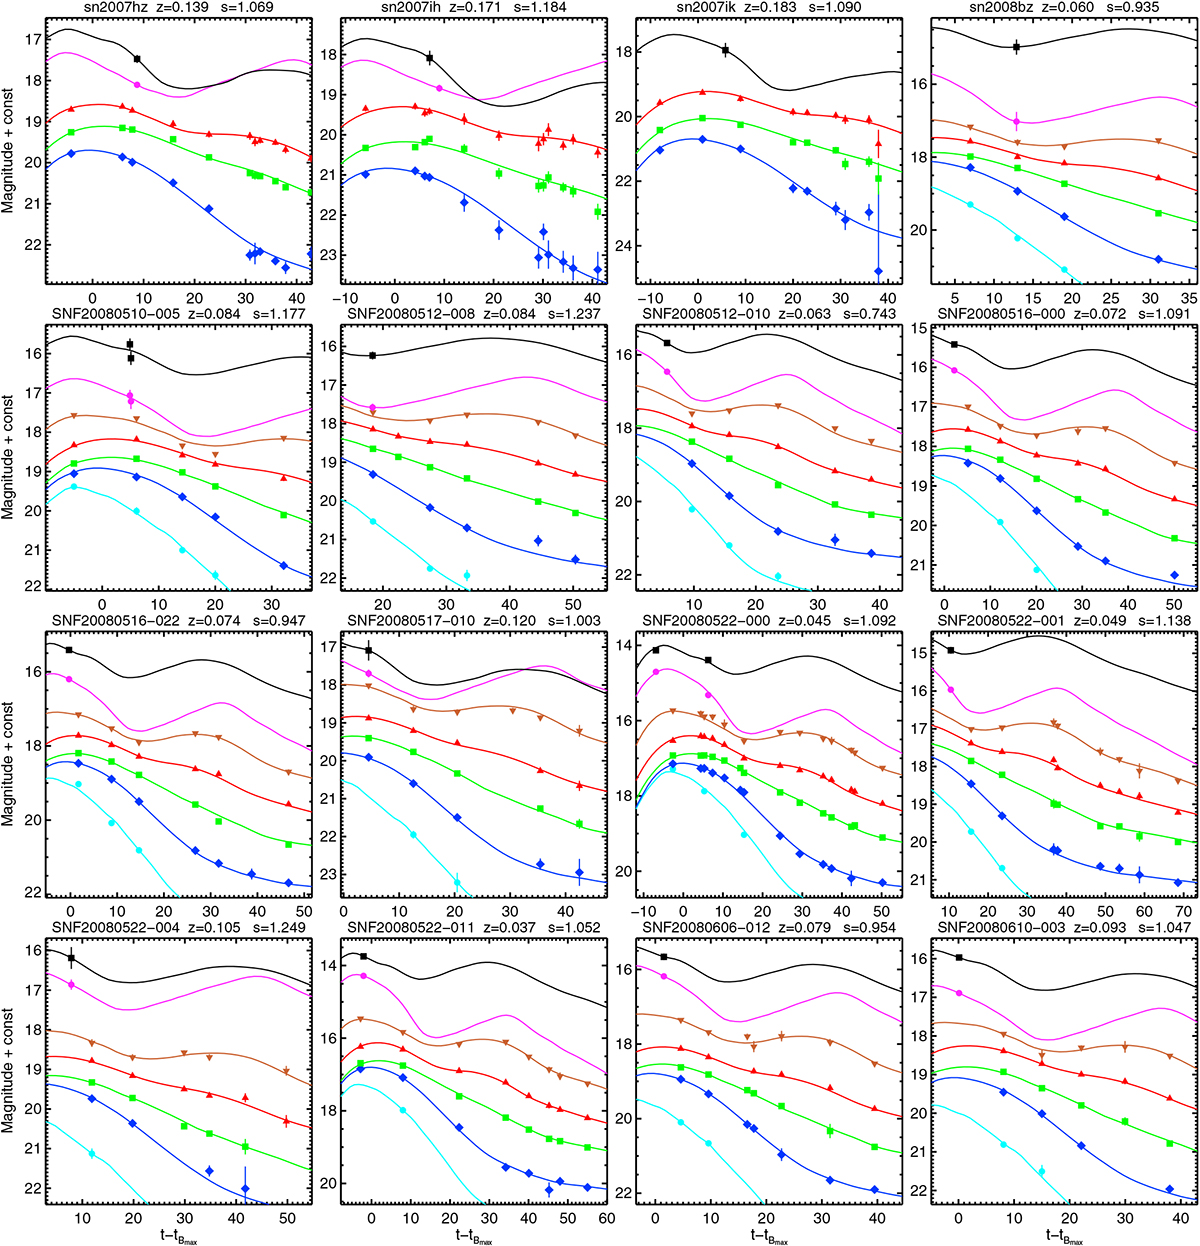
griJH and UBV RIJH LCs and the best fits. For the three SDSS-II SNe (2007hz, 2007ih, 2007ik) from bottom to top are plotted g, r − 0.4, i − 1, J − 2.8 and H − 3.8 (no J for SN 2007ik). For the other 13 SNe are plotted U + 0.8, B, V − 0.2, R − 0.6, I − 1.6, J − 3 and H − 3.5. We note that the simultaneous gri or UBV RI fits were only used for these plots. In the analysis we use the results from the simultaneous fits of the g and r, and B and V bands only.
Current usage metrics show cumulative count of Article Views (full-text article views including HTML views, PDF and ePub downloads, according to the available data) and Abstracts Views on Vision4Press platform.
Data correspond to usage on the plateform after 2015. The current usage metrics is available 48-96 hours after online publication and is updated daily on week days.
Initial download of the metrics may take a while.