Fig. 2.
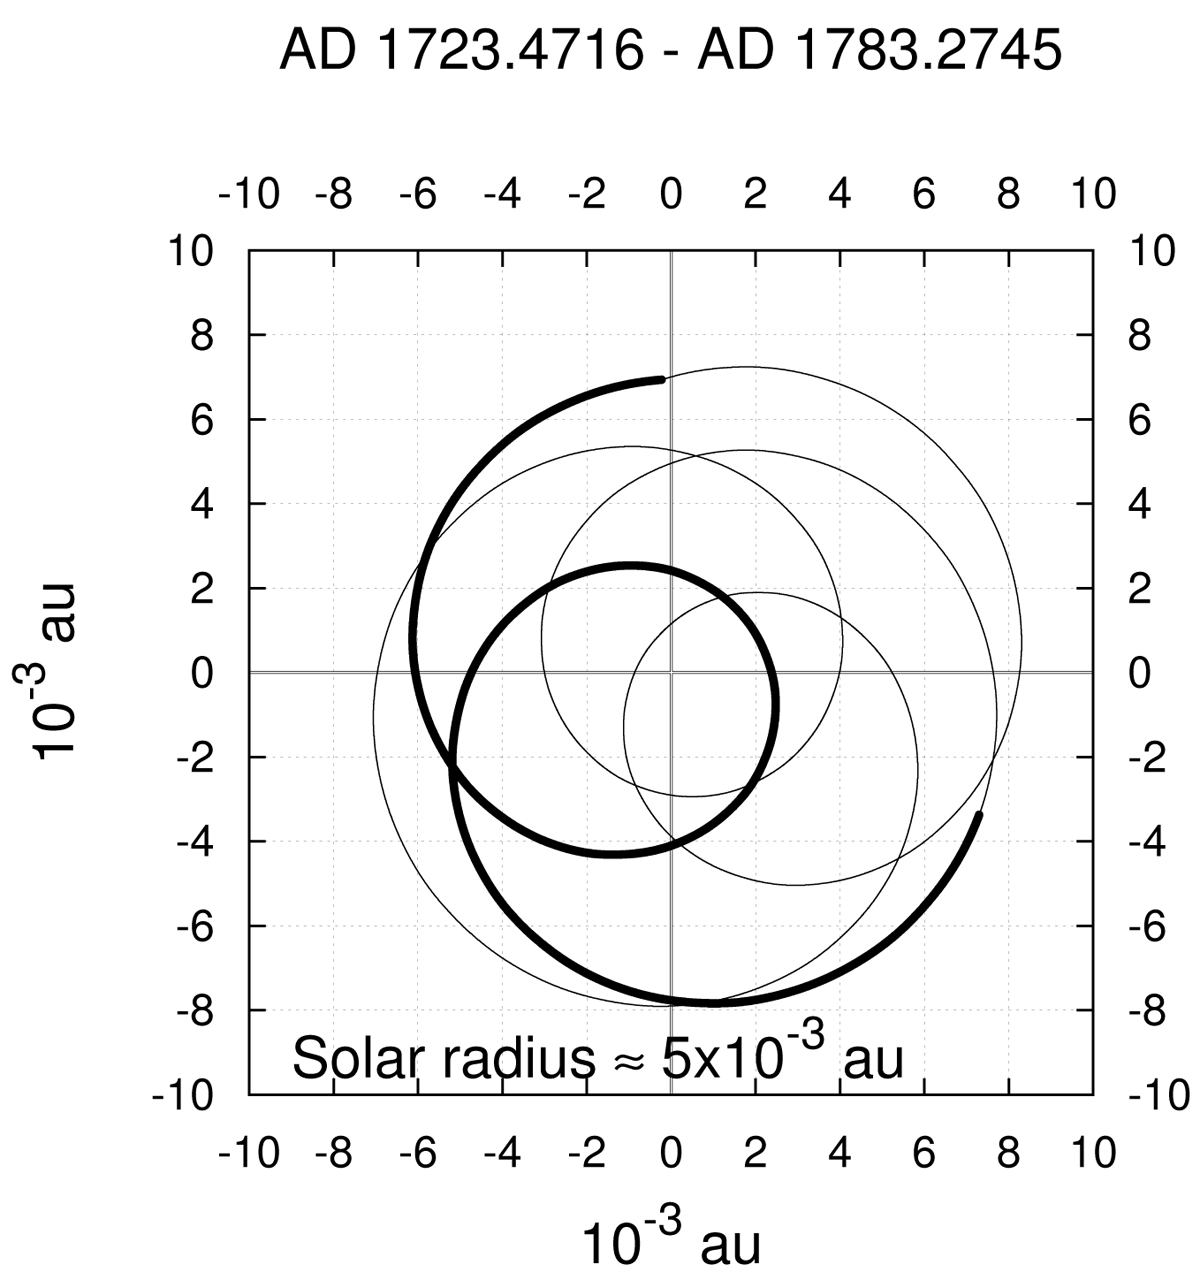
Trefoliar, particularly quasi-closed ~60 yr pattern of SBM for the indicated interval. The first JS period is marked as a thick line. The interval corresponds to the closest approximation to the initial position on the IP. The x-axis of the figure coincides with the nodal line equator-IP (see Appendix A for further information).
Current usage metrics show cumulative count of Article Views (full-text article views including HTML views, PDF and ePub downloads, according to the available data) and Abstracts Views on Vision4Press platform.
Data correspond to usage on the plateform after 2015. The current usage metrics is available 48-96 hours after online publication and is updated daily on week days.
Initial download of the metrics may take a while.