Fig. 9
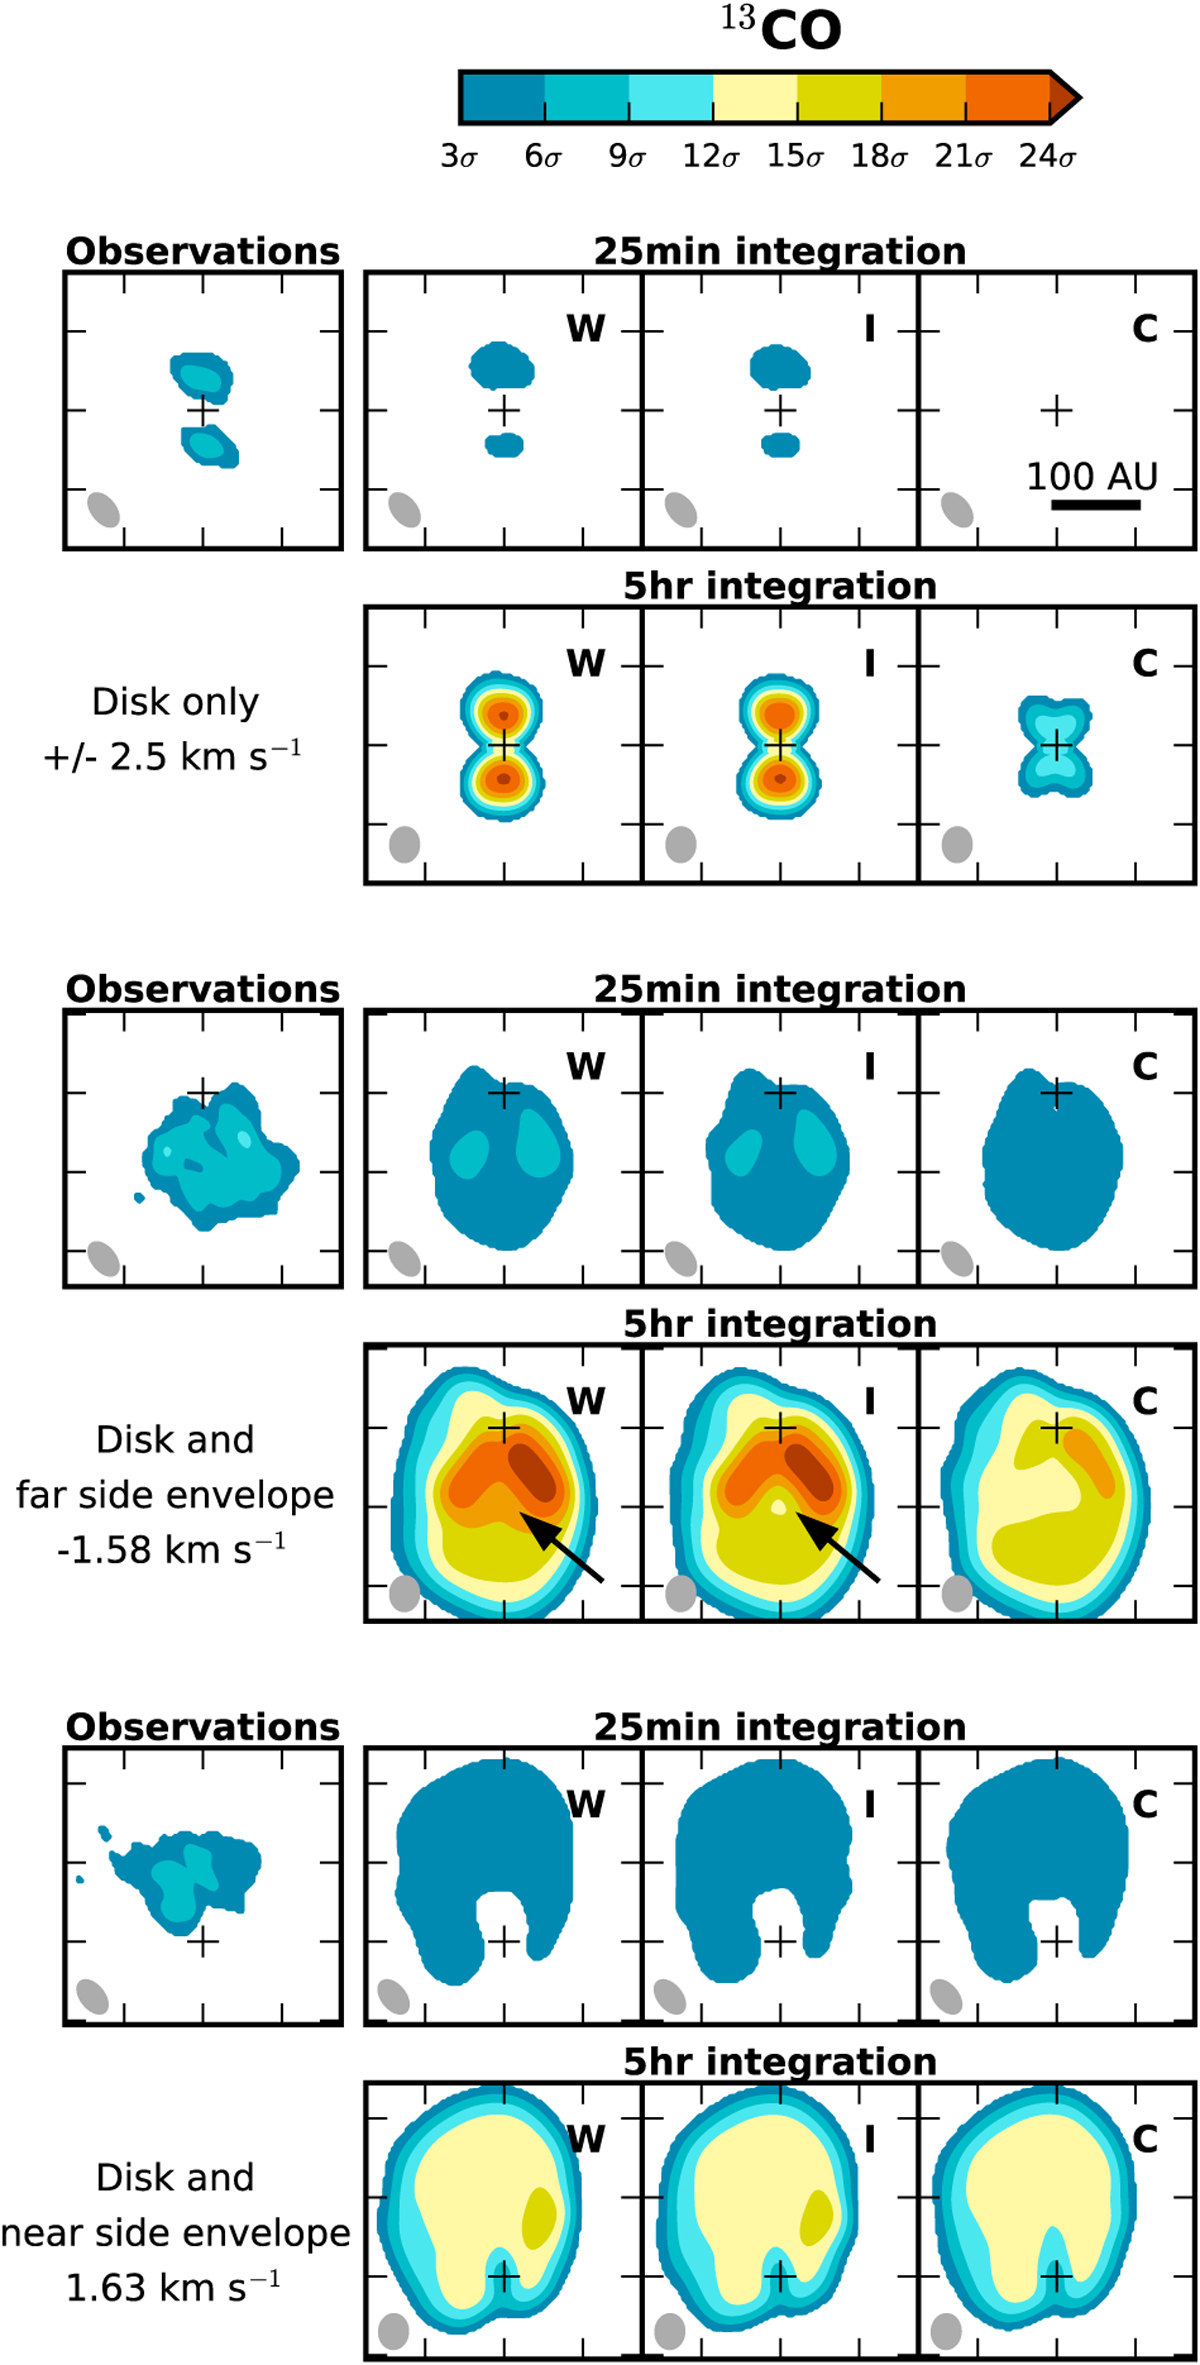
Comparison between the 13CO observations (left column) and the three different models (see Fig. 7): warm (W, second column), intermediate (I, third column), and cold (C, fourth column). Emission is simulated with the same visibilities as the observations (25 minutes integration) and for a longer integration time of five hours in a configuration producing a similar beam size. Four representative velocity channels are shown. Top panels: emission at ±2.5 km s−1, which is expected to originate in the disk. Middle panels: blueshifted emission from the disk and far side of the envelope (Δv = −1.58 km s−1), and bottom panels: redshifted emission from the disk and near side of the envelope (Δv = 1.63 km s−1). The color scale is in steps of 3σ, which corresponds to 30.6 (8.8) mJy beam−1 channel−1 for an integration time of 25 minutes (five hours). The black arrow denotes the difference between the warm and intermediate model, which becomes clear for a five hour integration. The position of the continuum peak is marked by a cross; the vertical scale is the same for all velocities, but slightly shifted. The beam is shown in the lower left corner of each panel.
Current usage metrics show cumulative count of Article Views (full-text article views including HTML views, PDF and ePub downloads, according to the available data) and Abstracts Views on Vision4Press platform.
Data correspond to usage on the plateform after 2015. The current usage metrics is available 48-96 hours after online publication and is updated daily on week days.
Initial download of the metrics may take a while.