Fig. 8
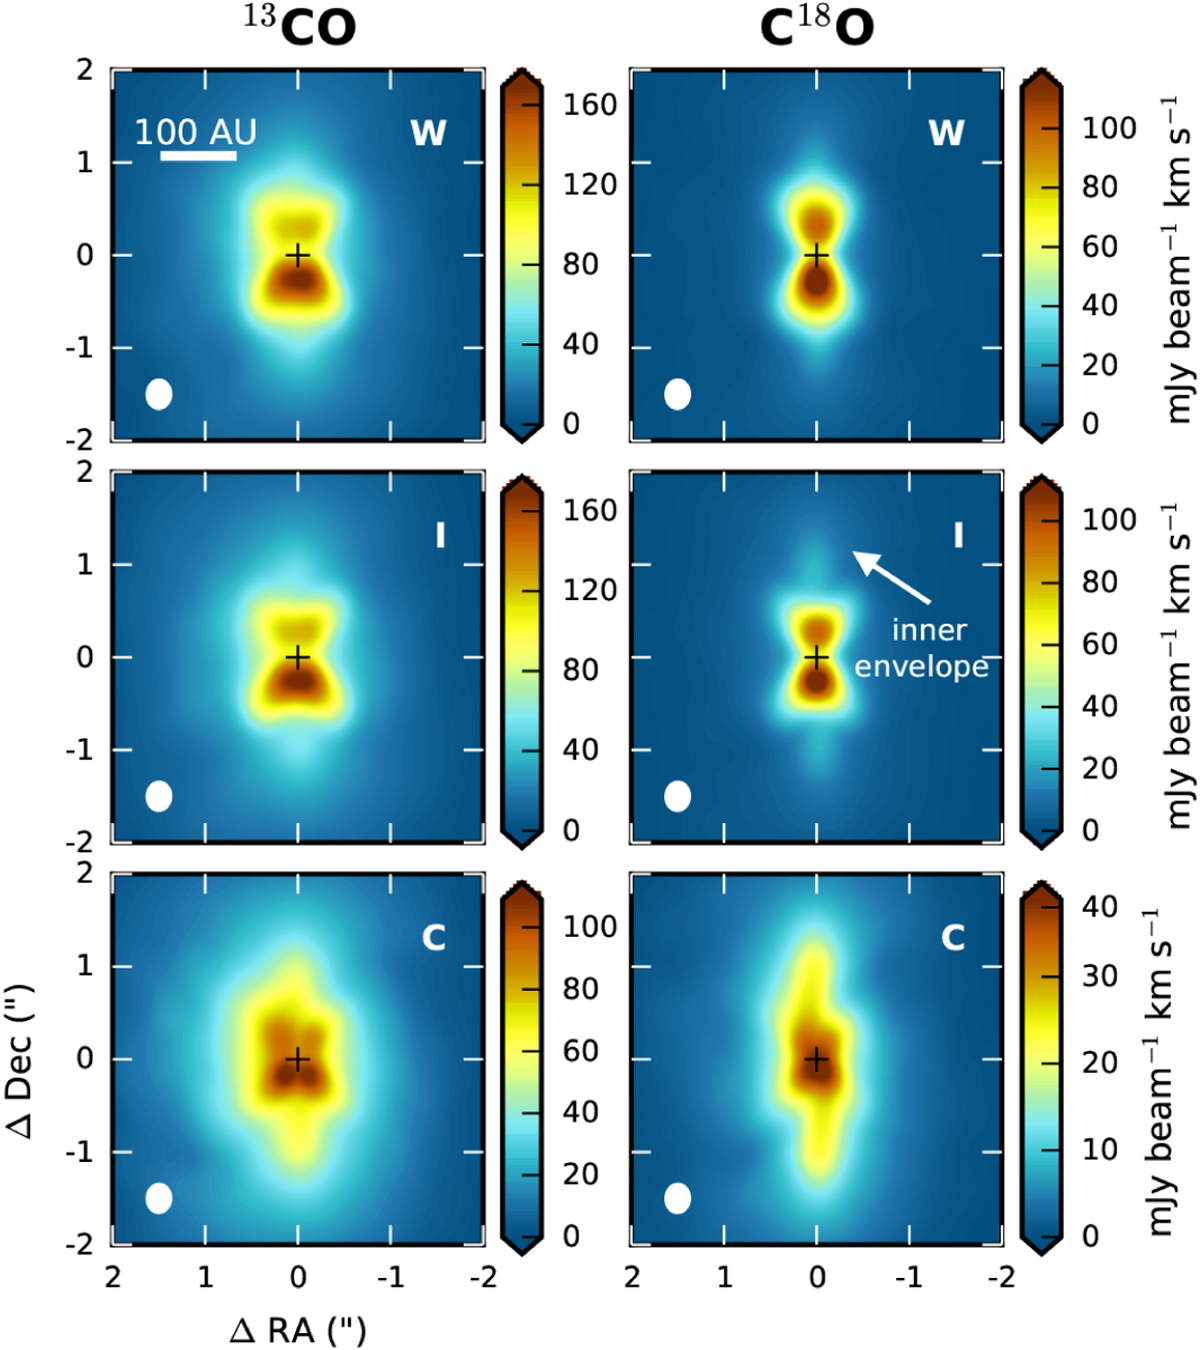
Integrated intensity (zeroth moment) maps for 13CO (left panels) and C18O (right panels) in the warm (W; top row), intermediate (I; middle row) and cold (C; bottom row) model. Emission is simulated for a five hour integration using an ALMA configuration resulting in a similar beam size as the observations. The intensity (color) scale is different for each panel. The position of the continuum peak is marked by a black cross and the beam is shown in the lower left corner of the panels.
Current usage metrics show cumulative count of Article Views (full-text article views including HTML views, PDF and ePub downloads, according to the available data) and Abstracts Views on Vision4Press platform.
Data correspond to usage on the plateform after 2015. The current usage metrics is available 48-96 hours after online publication and is updated daily on week days.
Initial download of the metrics may take a while.