Fig. 4
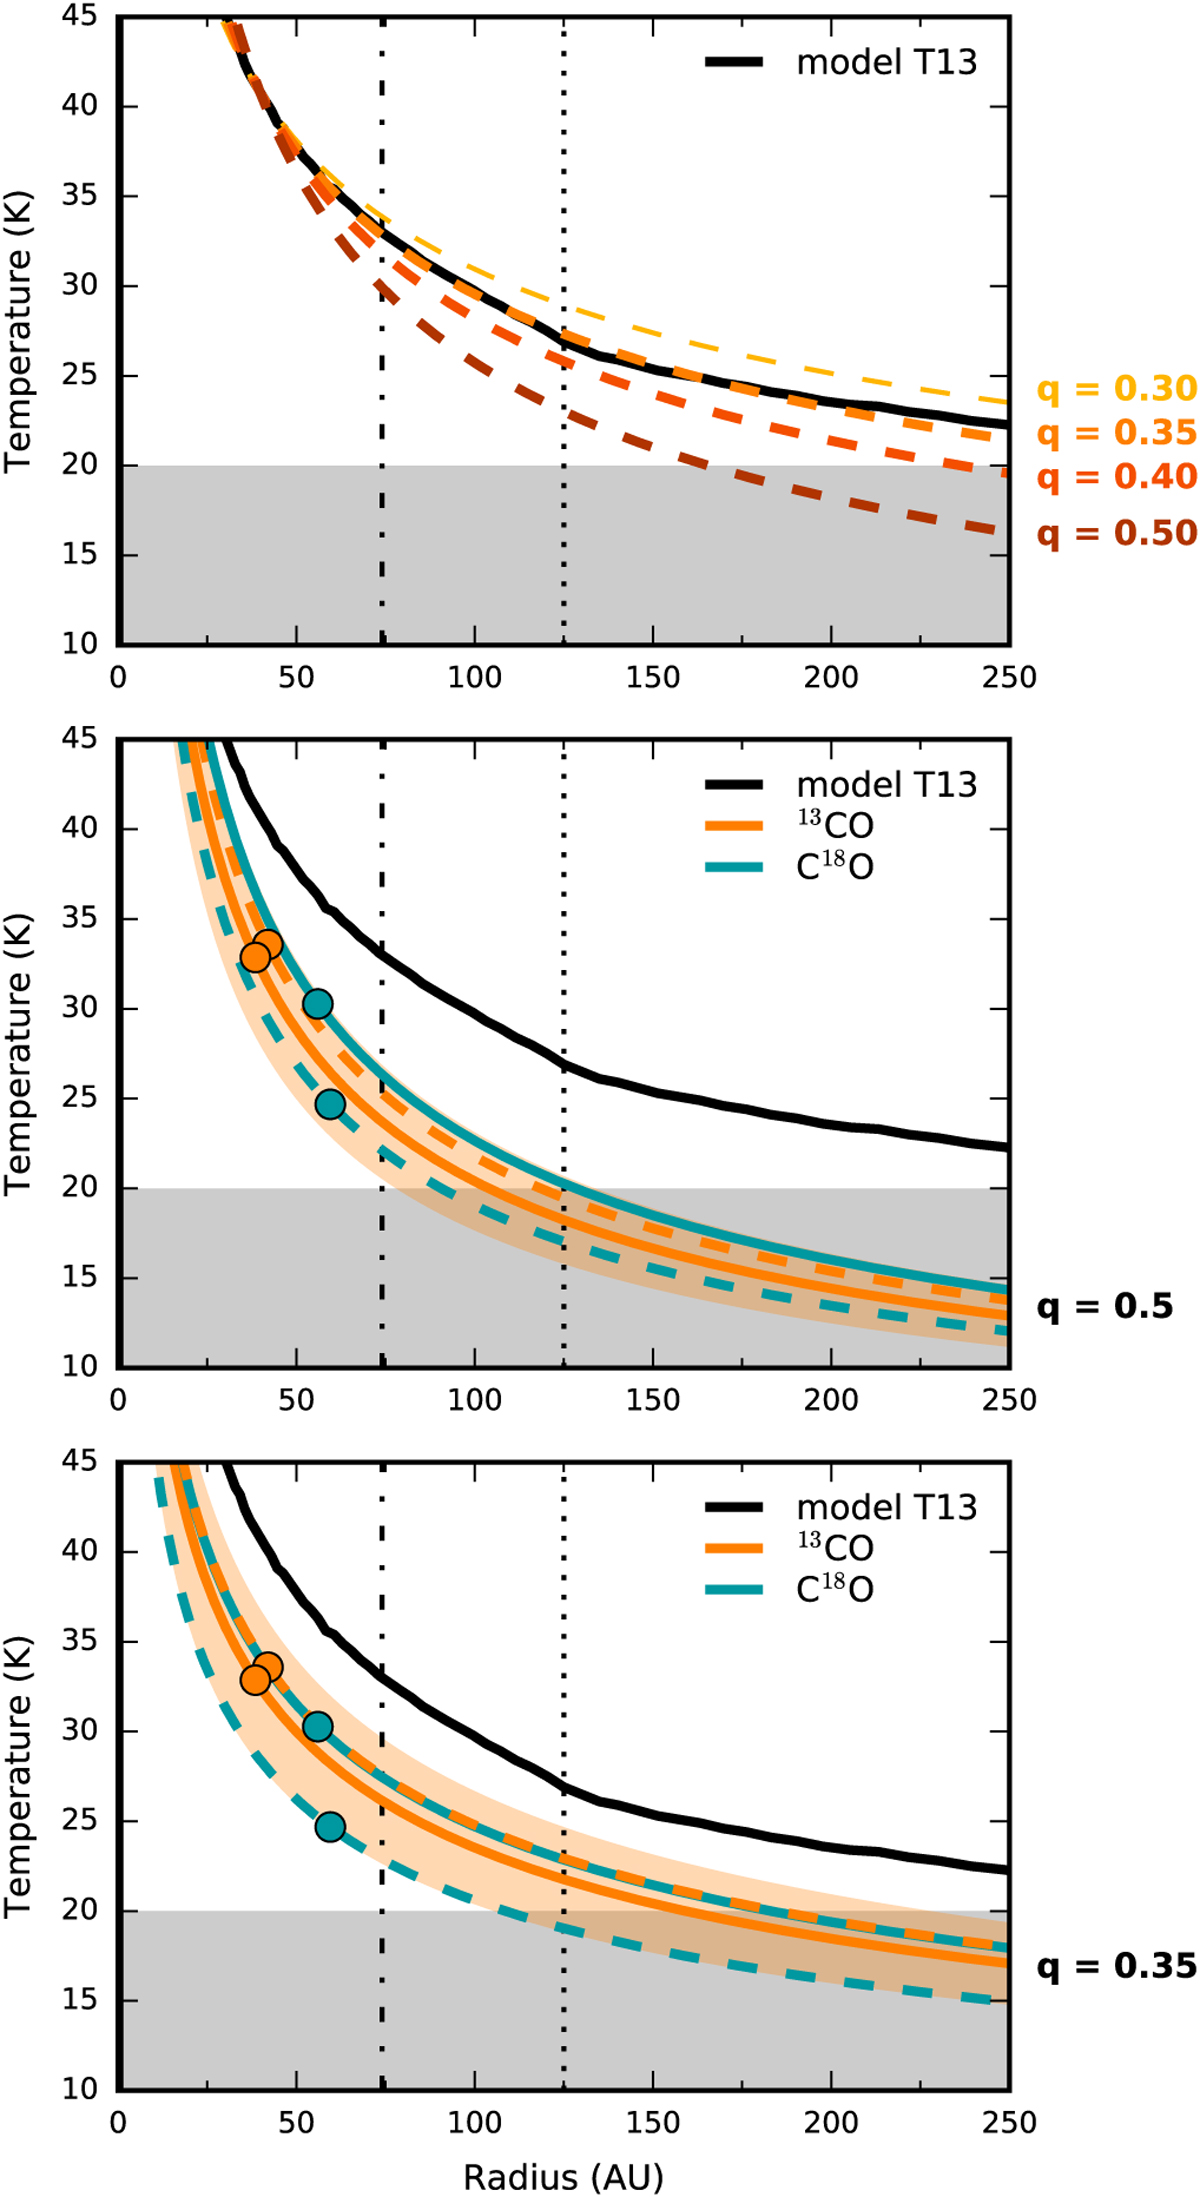
Radial midplane temperature profiles for the L1527 disk and inner envelope. Top panel: comparison between the temperature profile from the T13 model and power laws with different exponents (q). Middle and bottom panels: power law profiles derived from 13CO (orange lines) and C18O observations(blue lines) assuming q = 0.5 and q = 0.35, respectively. Solid lines are derived from a redshifted channel, dashed lines from a blueshifted channel. The measured values are indicated by filled circles. The orange shaded area shows the 1σ uncertainty on the solid orange line (13CO from redshifted channel). The gray shaded area marks the temperature range for which CO is expected to be frozen out (i.e., below 20 K). The vertical dash-dotted line marks a disk radius of 74 au as determined by A17, and the dotted line a disk radius of 125 au derived by T13.
Current usage metrics show cumulative count of Article Views (full-text article views including HTML views, PDF and ePub downloads, according to the available data) and Abstracts Views on Vision4Press platform.
Data correspond to usage on the plateform after 2015. The current usage metrics is available 48-96 hours after online publication and is updated daily on week days.
Initial download of the metrics may take a while.