Fig. 2
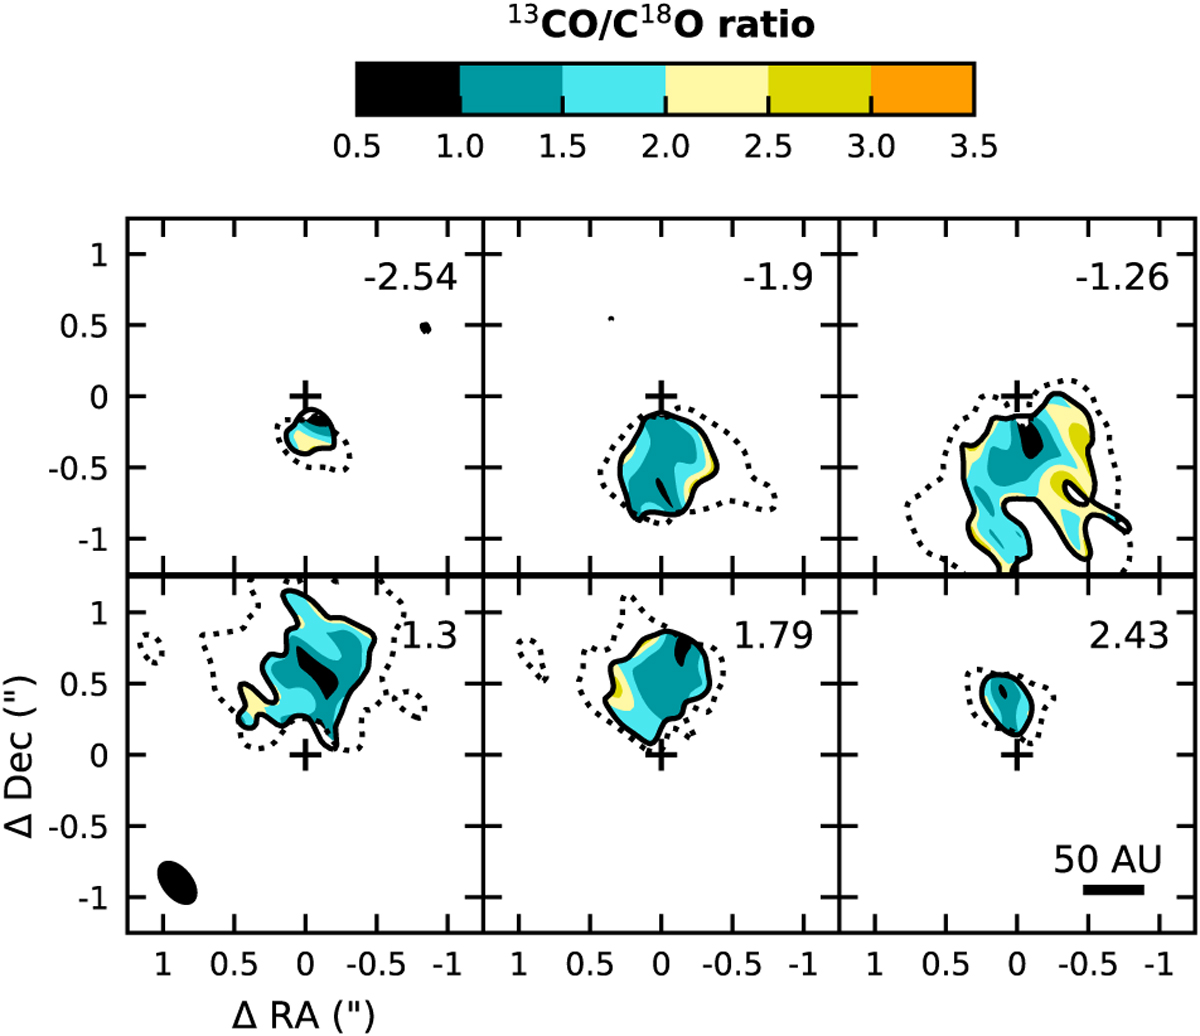
13CO (J = 2–1)/C18O (J = 2–1) line intensity ratio in six representative velocity channels. The velocity relative to the systemic velocity of vlsr = 5.9 km s−1 is listed in the top right corner of each panel and the channel width is 0.16 km s−1. The line ratio is only calculated in pixels with at least a 3σ detection forboth 13CO and C18O. The dotted and solid contours mark the respective 3σ levels. The plotted spatial scale is such as to highlight the inner ~1′′ (140 au), that is, the disk and inner envelope. The continuum peak position is indicated with a cross and the synthesized beam is shown in the lower left corner of the lower left panel.
Current usage metrics show cumulative count of Article Views (full-text article views including HTML views, PDF and ePub downloads, according to the available data) and Abstracts Views on Vision4Press platform.
Data correspond to usage on the plateform after 2015. The current usage metrics is available 48-96 hours after online publication and is updated daily on week days.
Initial download of the metrics may take a while.