Free Access
Fig. C.3
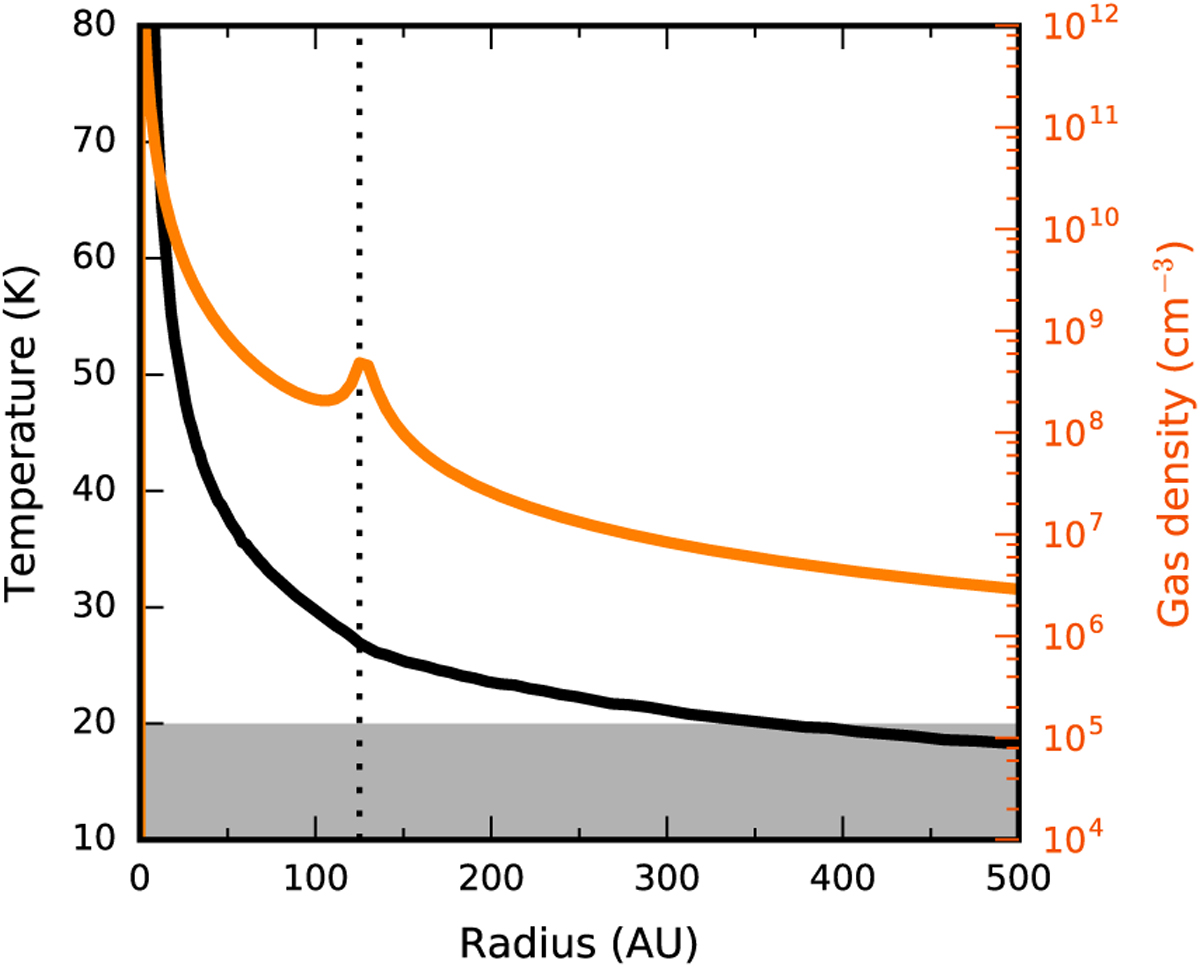
Midplane temperature (black) and density (orange) profile from the best fit model from T13 for the disk and inner envelope of L1527. The vertical dotted line marks the disk outer radius and the gray area shows the temperature range (<20 K) for which CO is expected to be frozen out.
Current usage metrics show cumulative count of Article Views (full-text article views including HTML views, PDF and ePub downloads, according to the available data) and Abstracts Views on Vision4Press platform.
Data correspond to usage on the plateform after 2015. The current usage metrics is available 48-96 hours after online publication and is updated daily on week days.
Initial download of the metrics may take a while.