Fig. C.2
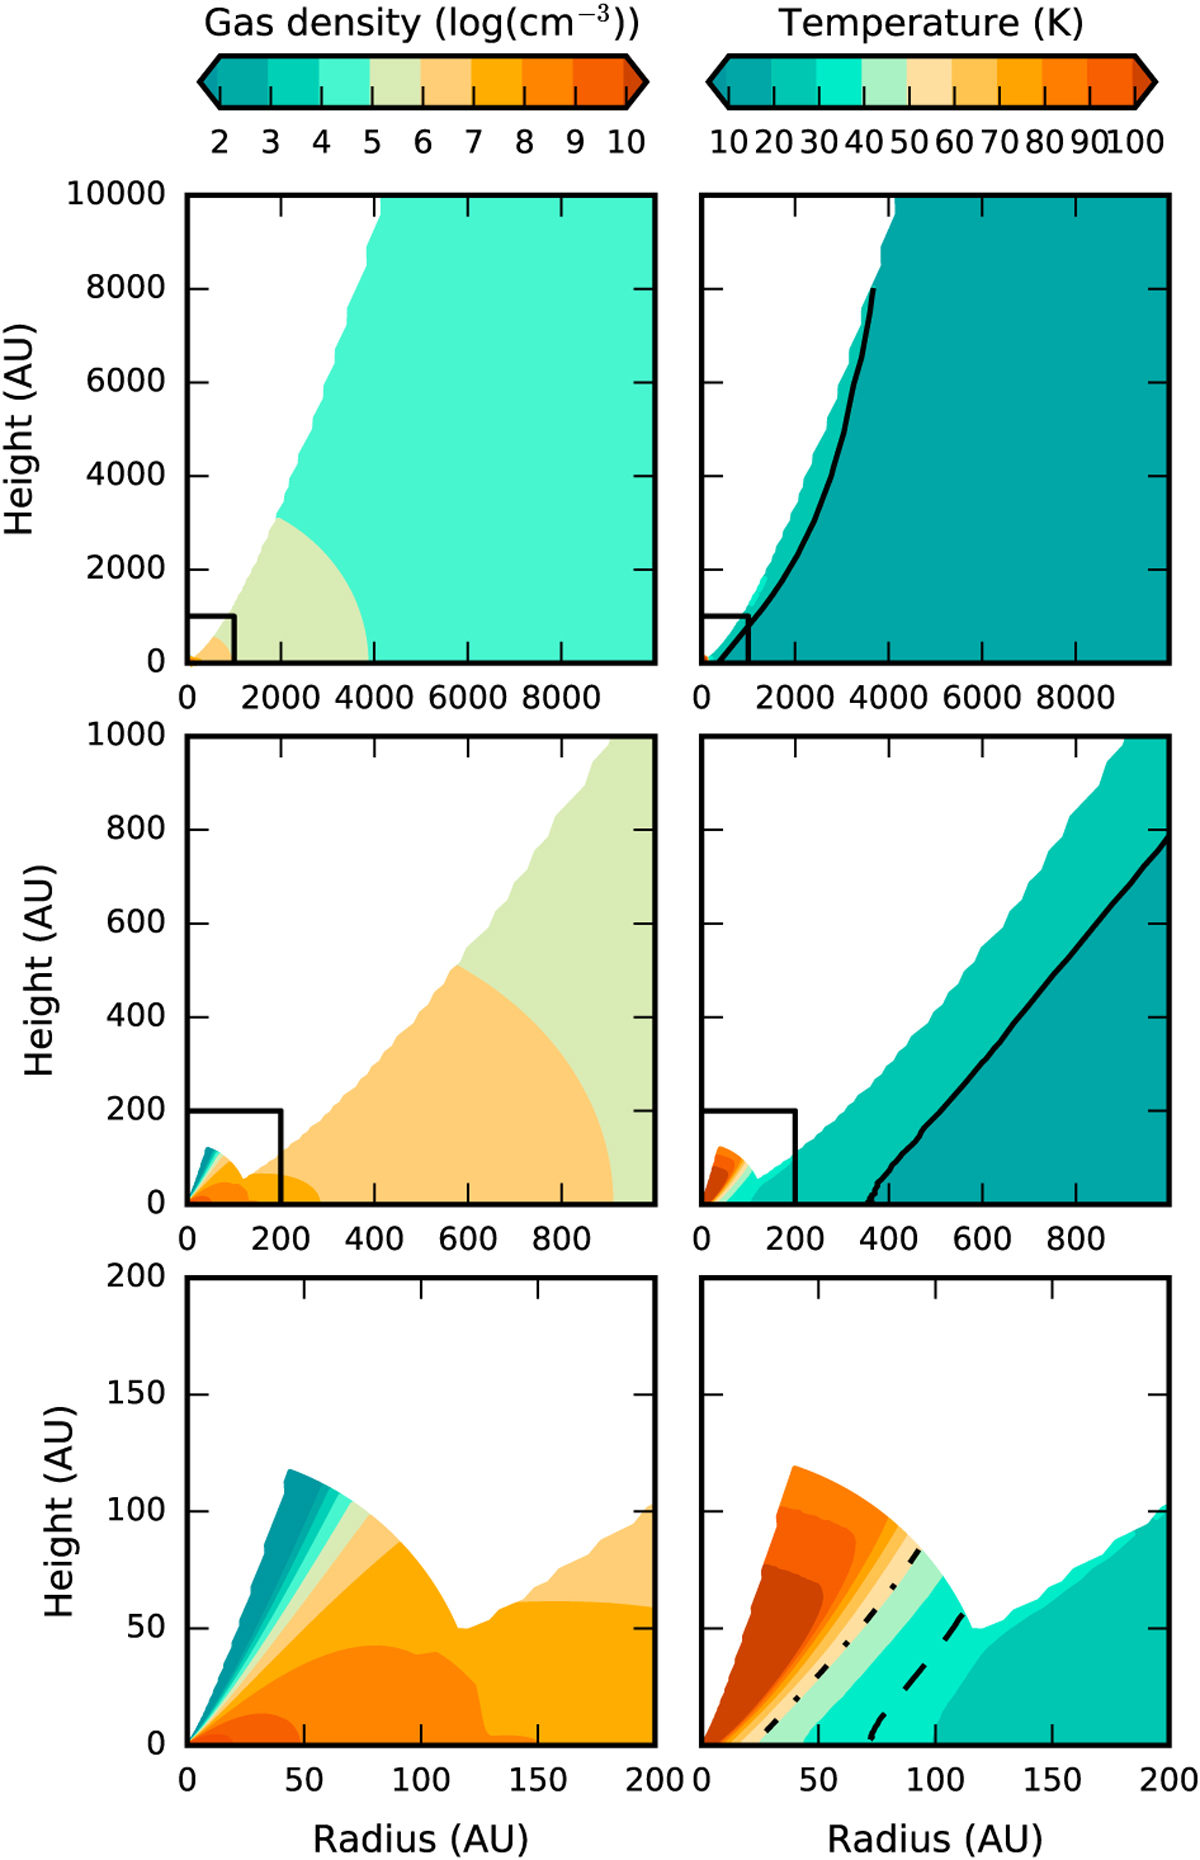
Density (left panels) and temperature (right panels) structure for the disk and envelope of L1527 from the T13 best fit model on a scale of 10 000 au (top panels), 1000 au (middple panels) and 200 au (bottom panels). The black boxes highlight the area shown in the row below. The solid black contours mark the CO snow surface (20 K). The location of the snow surface in the intermediate and cold models are indicated with dashed and dash-dotted contours, respectively.
Current usage metrics show cumulative count of Article Views (full-text article views including HTML views, PDF and ePub downloads, according to the available data) and Abstracts Views on Vision4Press platform.
Data correspond to usage on the plateform after 2015. The current usage metrics is available 48-96 hours after online publication and is updated daily on week days.
Initial download of the metrics may take a while.