Fig. 13
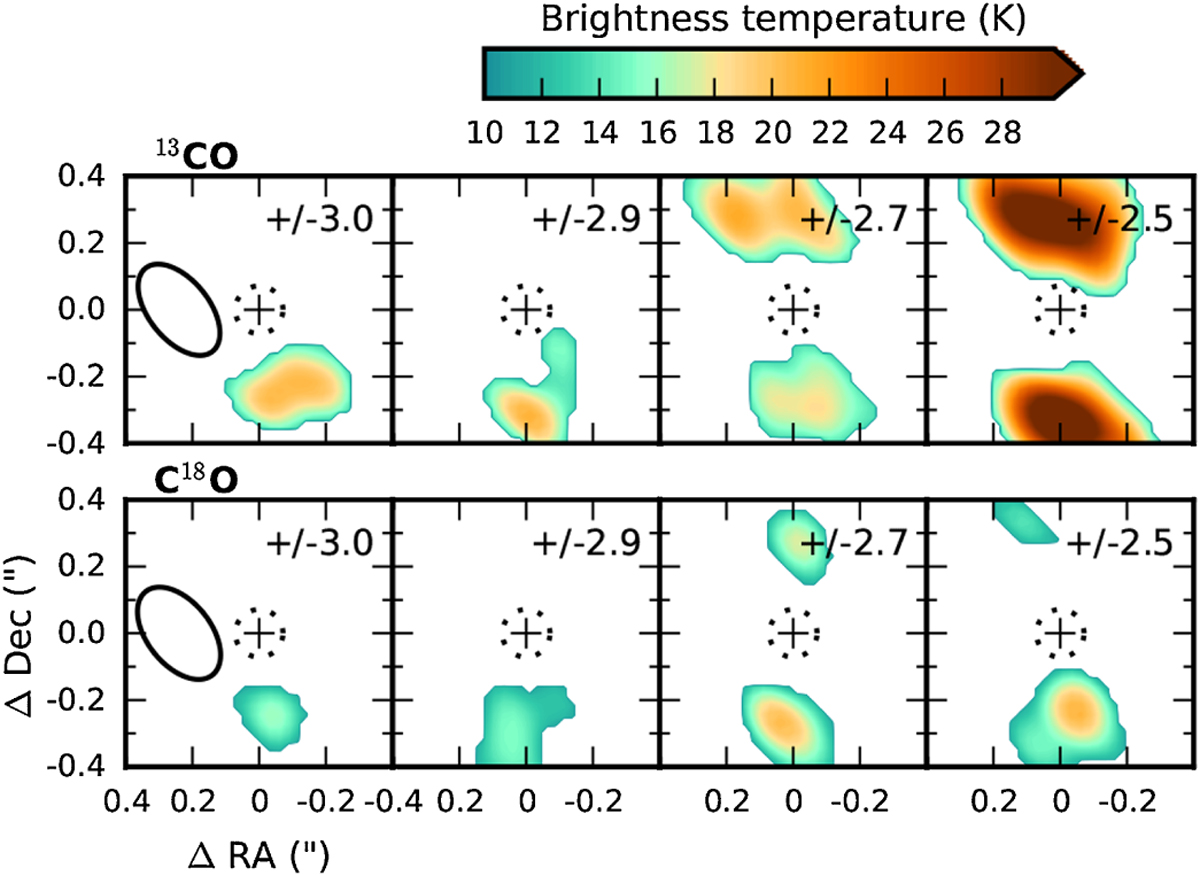
Magnification of the highest velocity channels for 13CO (top panels) and C18O (bottom panels), highlighting that the emission centroid does not move closer to the continuum peak position (marked with a cross) with increasing velocity offset. Only emission above the 3σ level is shown. The velocity relative to the systemic velocity of vlsr = 5.9 km s−1 is listed in the top right corner of each panel. For each velocity offset, both blue- (south of source position) and redshifted emission (north of source position) are shown in the same panel. The dotted contour marks the inner 10 au where the T13 model predicts the continuum to be optically thick. The black contour in the left panels shows the synthesized beam.
Current usage metrics show cumulative count of Article Views (full-text article views including HTML views, PDF and ePub downloads, according to the available data) and Abstracts Views on Vision4Press platform.
Data correspond to usage on the plateform after 2015. The current usage metrics is available 48-96 hours after online publication and is updated daily on week days.
Initial download of the metrics may take a while.