Fig. 12
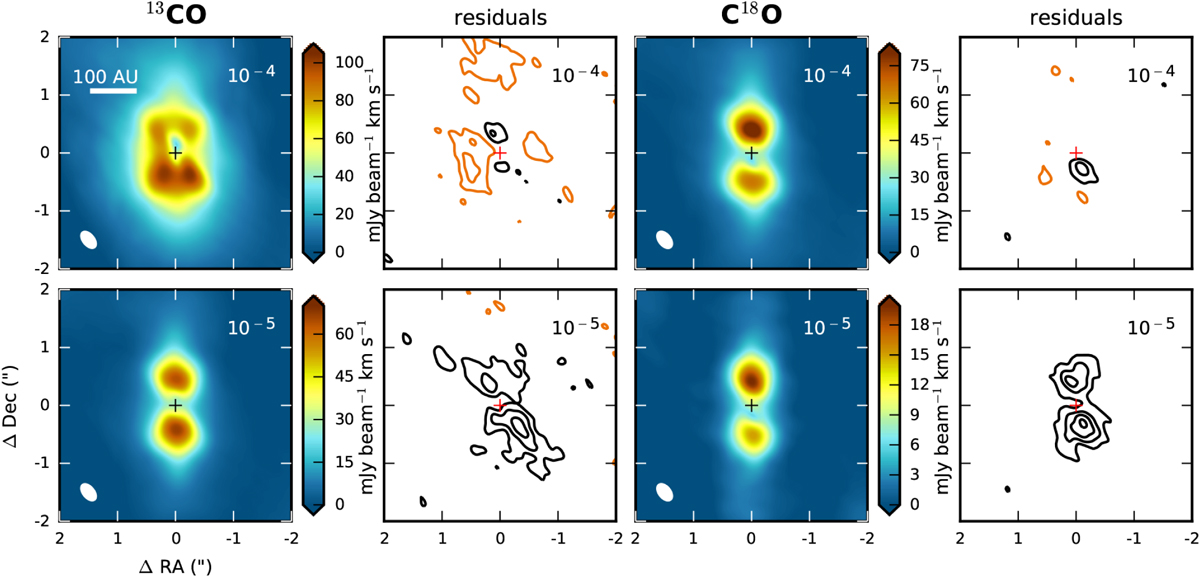
Integrated intensity (zeroth moment) maps for 13CO (first column) and C18O (third column) in the warm model with a constant CO abundance of 10−4 (top row) and 10−5 (bottom row). The emission is simulated with the observed uv-coverage (25 minutes integration). The intensity (color) scale is different for each panel. Second and fourth columns: residuals obtained by subtracting the models from the observations. Black contours are in steps of 3σ starting at 3σ, while orangecontours are in steps of − 3σ and start at − 3σ. For 13CO (C18O), 3σ corresponds to 25.9 (21.8) mJy beam−1 km s−1. The position of the continuum peak is marked by a cross and the beam is shown in the lower left corner of the moment zero maps.
Current usage metrics show cumulative count of Article Views (full-text article views including HTML views, PDF and ePub downloads, according to the available data) and Abstracts Views on Vision4Press platform.
Data correspond to usage on the plateform after 2015. The current usage metrics is available 48-96 hours after online publication and is updated daily on week days.
Initial download of the metrics may take a while.