Fig. 11
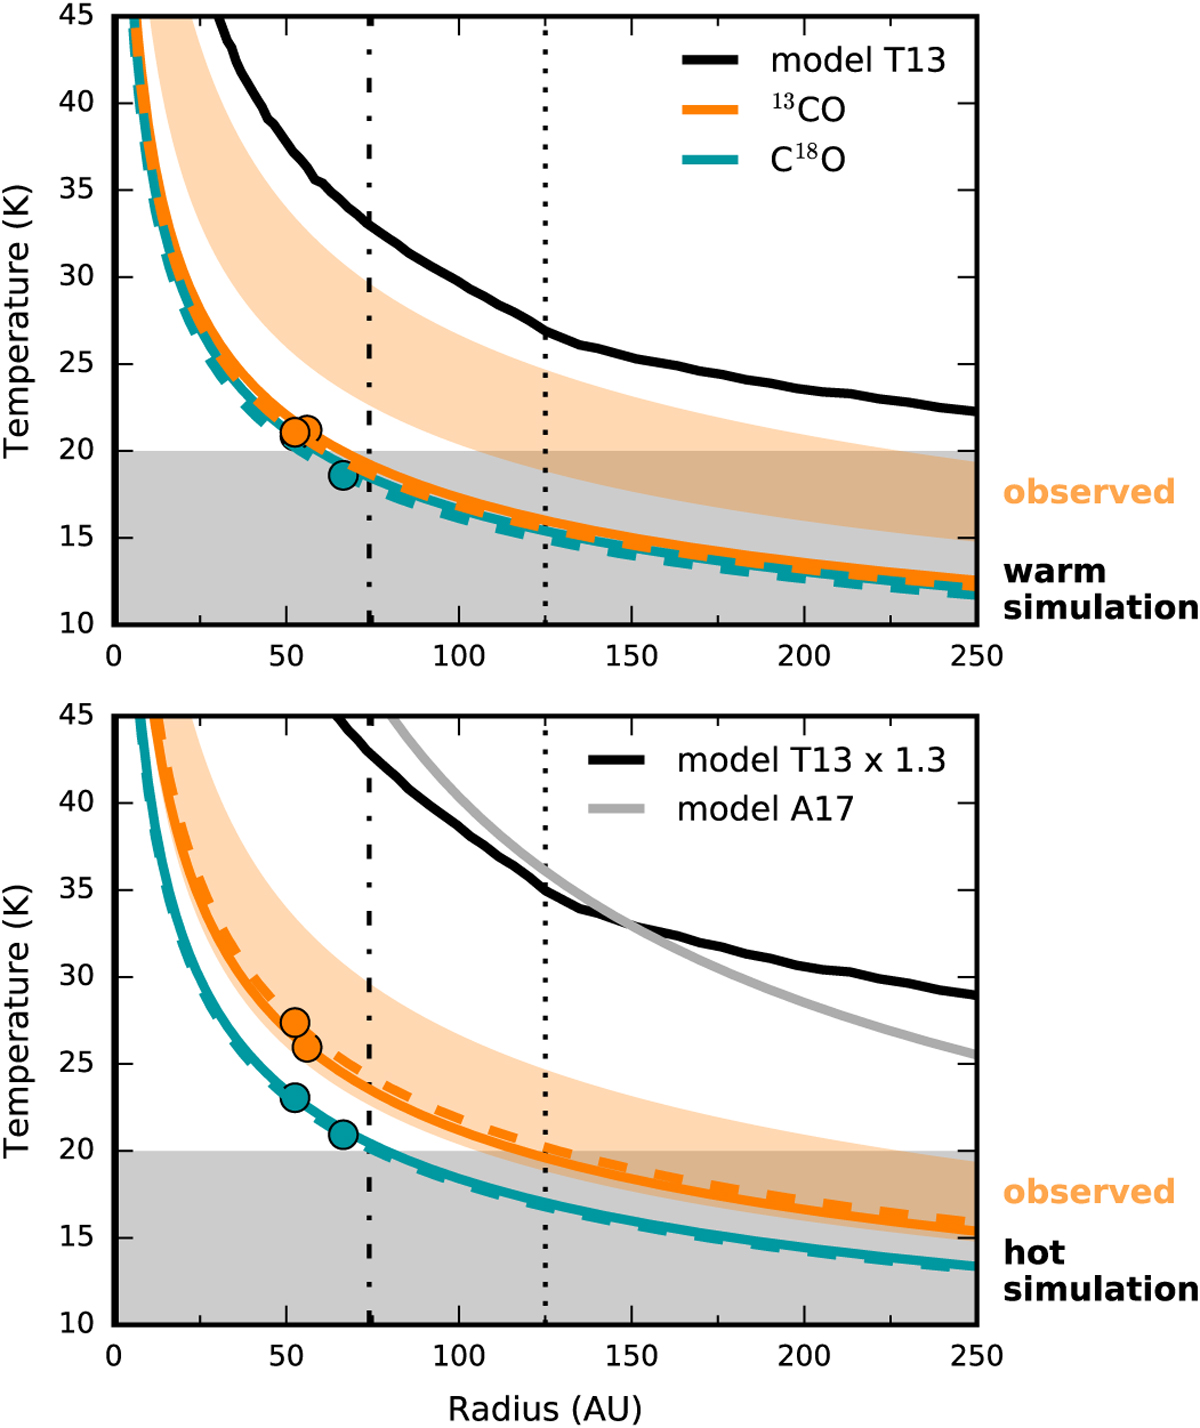
Power law temperature profiles (q = 0.35) as shown in Fig. 4, but now derived from images simulated with the observed uv-coverage (25 minutes integration). Top panel: results for the warm model, that is, the fiducial T13 temperature structure. Bottom panel: results for the hot model, that is, the T13 temperature increased by 30%. The black lines show the midplane temperature profile in the corresponding models used to generate the images. The gray line represents the midplane temperature used by A17. The shaded orange area marks the 1σ uncertainty on the temperature profile derived from the observations (13CO, redshifted channel), as shown in Fig. 4.
Current usage metrics show cumulative count of Article Views (full-text article views including HTML views, PDF and ePub downloads, according to the available data) and Abstracts Views on Vision4Press platform.
Data correspond to usage on the plateform after 2015. The current usage metrics is available 48-96 hours after online publication and is updated daily on week days.
Initial download of the metrics may take a while.