Fig. 1
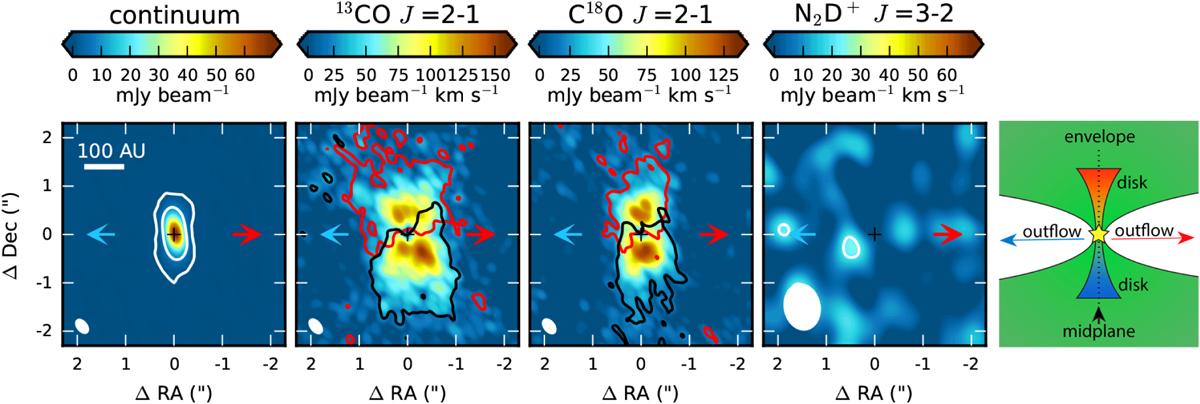
Continuum image toward L1527 at 1.3 mm (first panel) and integrated intensity maps for the 13CO J = 2–1 (second panel), C18O J = 2–1 (third panel)and N2D+ J = 3–2 (fourth panel) transitions. For 13CO and C18O, only channels with a >3σ detection are included. The red and black contours indicate the 3σ level of the red- and blueshifted emission, which corresponds to 18 and 21 mJy beam−1 km s−1 for 13CO, and 17 and 18 mJy beam−1 km s−1 for C18 O. The white contours denote the 5σ and 50σ levels (1σ = 0.13 mJy beam−1) for the continuum, and the 3σ (20 mJy beam−1 km s−1) level for N2D+. The positionof the continuum peak (α(J2000) = 04h39m53. s88; δ(J2000) = 26°03′09. ′′57) is marked by a black cross and the blue and red arrows show the direction of the outflow. The beam is shown in the lower left corner of each panel. The right panel shows a schematic view of the disk and inner envelope. The midplane is indicated bya dotted line.
Current usage metrics show cumulative count of Article Views (full-text article views including HTML views, PDF and ePub downloads, according to the available data) and Abstracts Views on Vision4Press platform.
Data correspond to usage on the plateform after 2015. The current usage metrics is available 48-96 hours after online publication and is updated daily on week days.
Initial download of the metrics may take a while.