Fig. 6
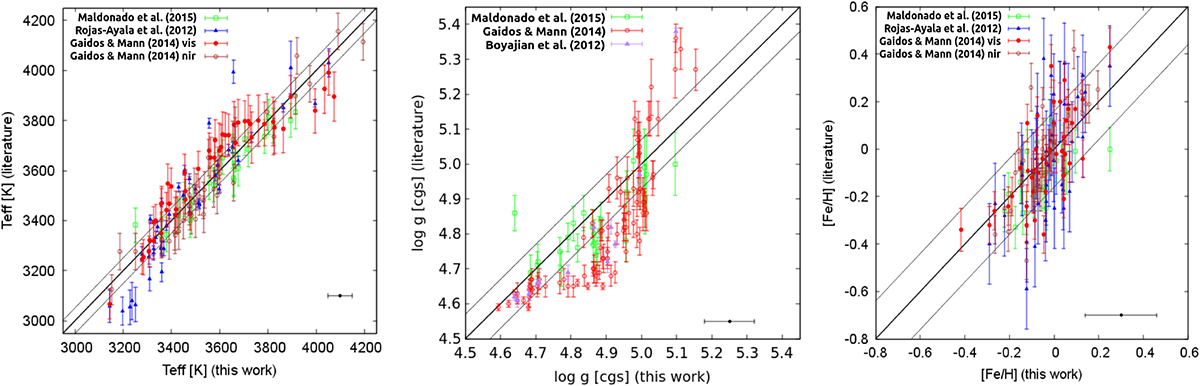
Comparison between values from our sample and literature values for Teff (left panel), logg (middle panel), and [Fe/H] (right panel). The black line indicates the 1:1 relation. The grey lines indicate the 1σ deviation of 51 K, 0.07 dex in logg, and 0.16 dex in [Fe/H]. The black dots with error bars in the lower right corner of each plot show the uncertainties of this work.
Current usage metrics show cumulative count of Article Views (full-text article views including HTML views, PDF and ePub downloads, according to the available data) and Abstracts Views on Vision4Press platform.
Data correspond to usage on the plateform after 2015. The current usage metrics is available 48-96 hours after online publication and is updated daily on week days.
Initial download of the metrics may take a while.