Fig. 5
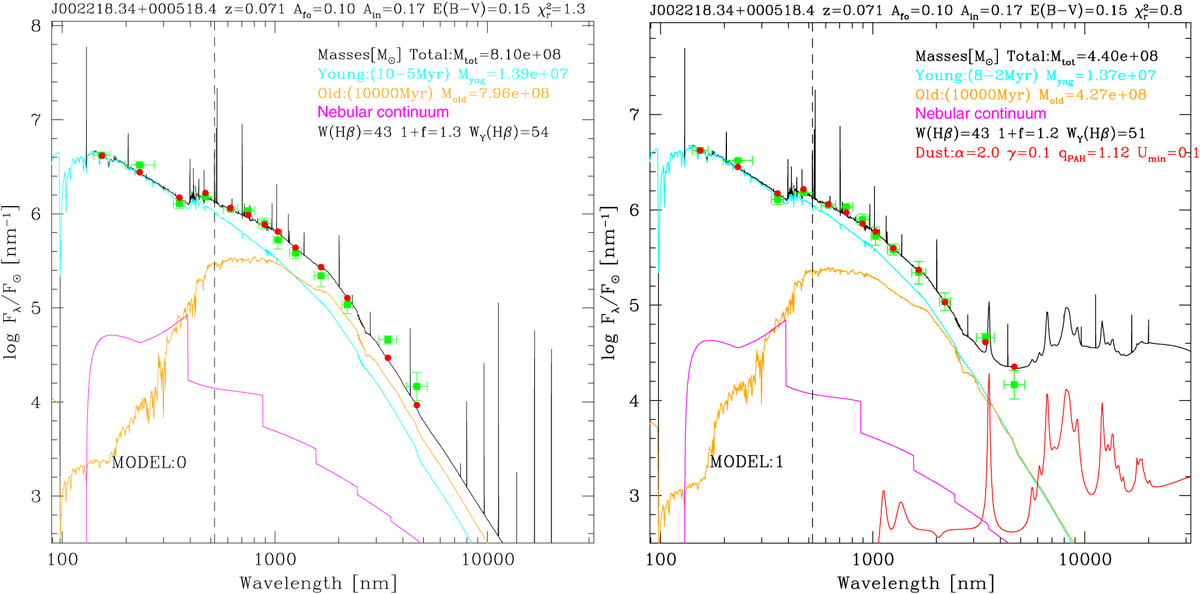
Comparing free fit without dust emission (left panel, MODEL 0) vs. with dust emission (right panel, MODEL 1). The Green points are the observed photometry from UV to MIR. Only the first two WISE data points are shown and used inthe fits. The solid lines are the modeled components: young stellar population (cyan), intermediate+old stellar population (orange), nebular continuum (magenta), and for MODEL 1 (right panel) the dust emission (red). The red points represent the model fit results for each photometric band. The information in the inset are the respective ages and derived masses of the stellar populations. The inset also shows the observed equivalent width of Hβ (WHβ) and the corrected equivalent width of Hβ for the young stellar component only (Wy(Hβ), see text.)
Current usage metrics show cumulative count of Article Views (full-text article views including HTML views, PDF and ePub downloads, according to the available data) and Abstracts Views on Vision4Press platform.
Data correspond to usage on the plateform after 2015. The current usage metrics is available 48-96 hours after online publication and is updated daily on week days.
Initial download of the metrics may take a while.