Fig. 4
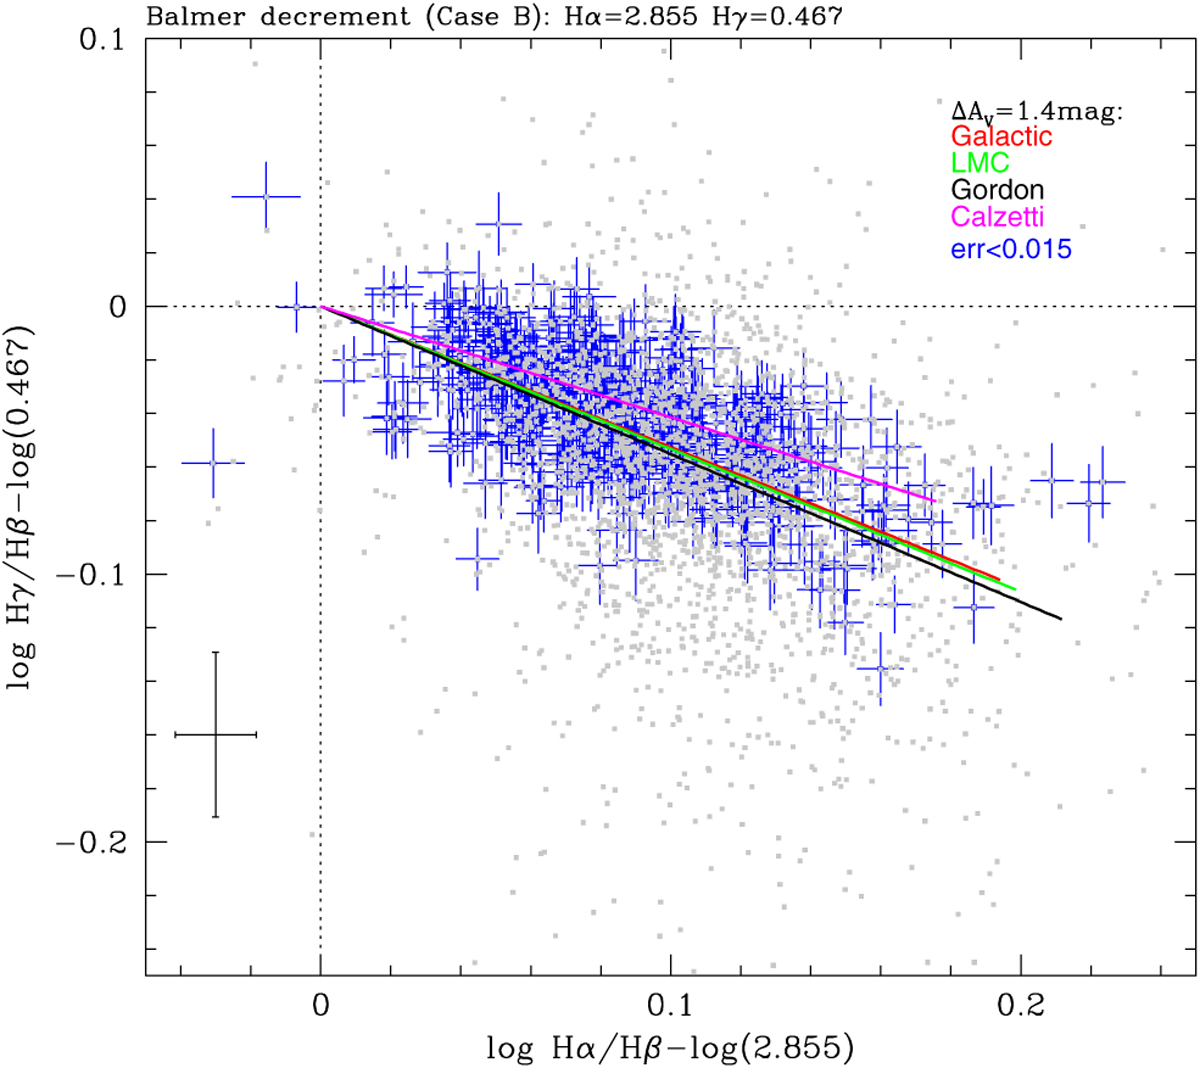
Balmer decrements for our sample relative to the theoretical Case B recombination values for Te = 11 400 K. The solid lines represent four different extinction laws as shown for a range of Δ AV = 1.4 mag. Points in gray are for the whole sample, while points in blue correspond to objects with errors in both axes < 0.015. The black cross at the bottom left represents the mean error of the whole sample.
Current usage metrics show cumulative count of Article Views (full-text article views including HTML views, PDF and ePub downloads, according to the available data) and Abstracts Views on Vision4Press platform.
Data correspond to usage on the plateform after 2015. The current usage metrics is available 48-96 hours after online publication and is updated daily on week days.
Initial download of the metrics may take a while.