Fig. 14
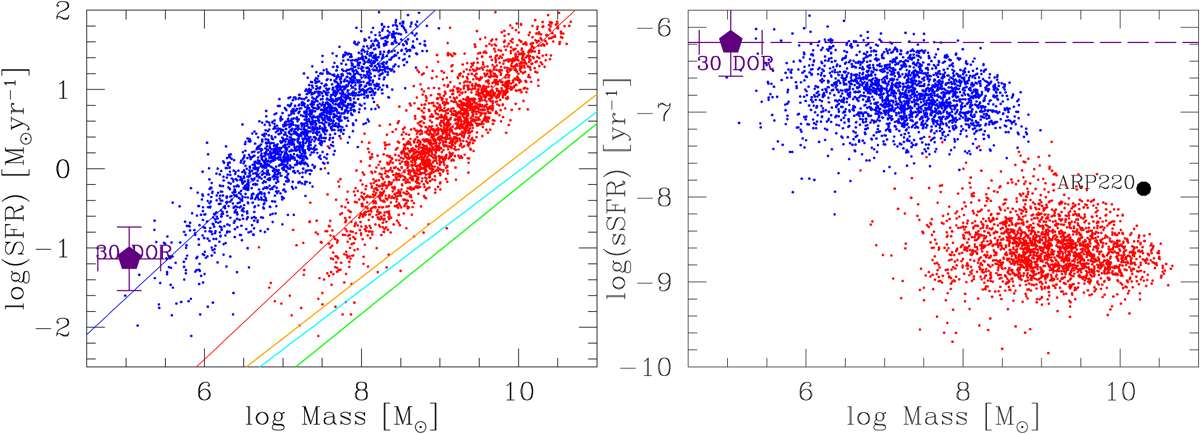
Left panel: main sequence of HII galaxies: current SFR derived from the calibration between our SFR averaged over 10 Myr from our SED fitting procedure vs. the LHβ from Eq. (4), as a function of Massyoung (blue points and line) and of Masstotal (red points and line). The green line is from Brinchmann et al. (2004), the cyan line from Chang et al. (2015), and the orange line from Elbaz et al. (2007; see text). Right panel: specific SFR as a function of stellar mass, as in the left panel. In both plots the positions of the genuine starburst 30 Dor in the LMC are given (magenta). The black point in the right panel represents the position of the ULIRG Arp 220 with SFR over ~200 M⊙yr−1.
Current usage metrics show cumulative count of Article Views (full-text article views including HTML views, PDF and ePub downloads, according to the available data) and Abstracts Views on Vision4Press platform.
Data correspond to usage on the plateform after 2015. The current usage metrics is available 48-96 hours after online publication and is updated daily on week days.
Initial download of the metrics may take a while.