Fig. 11
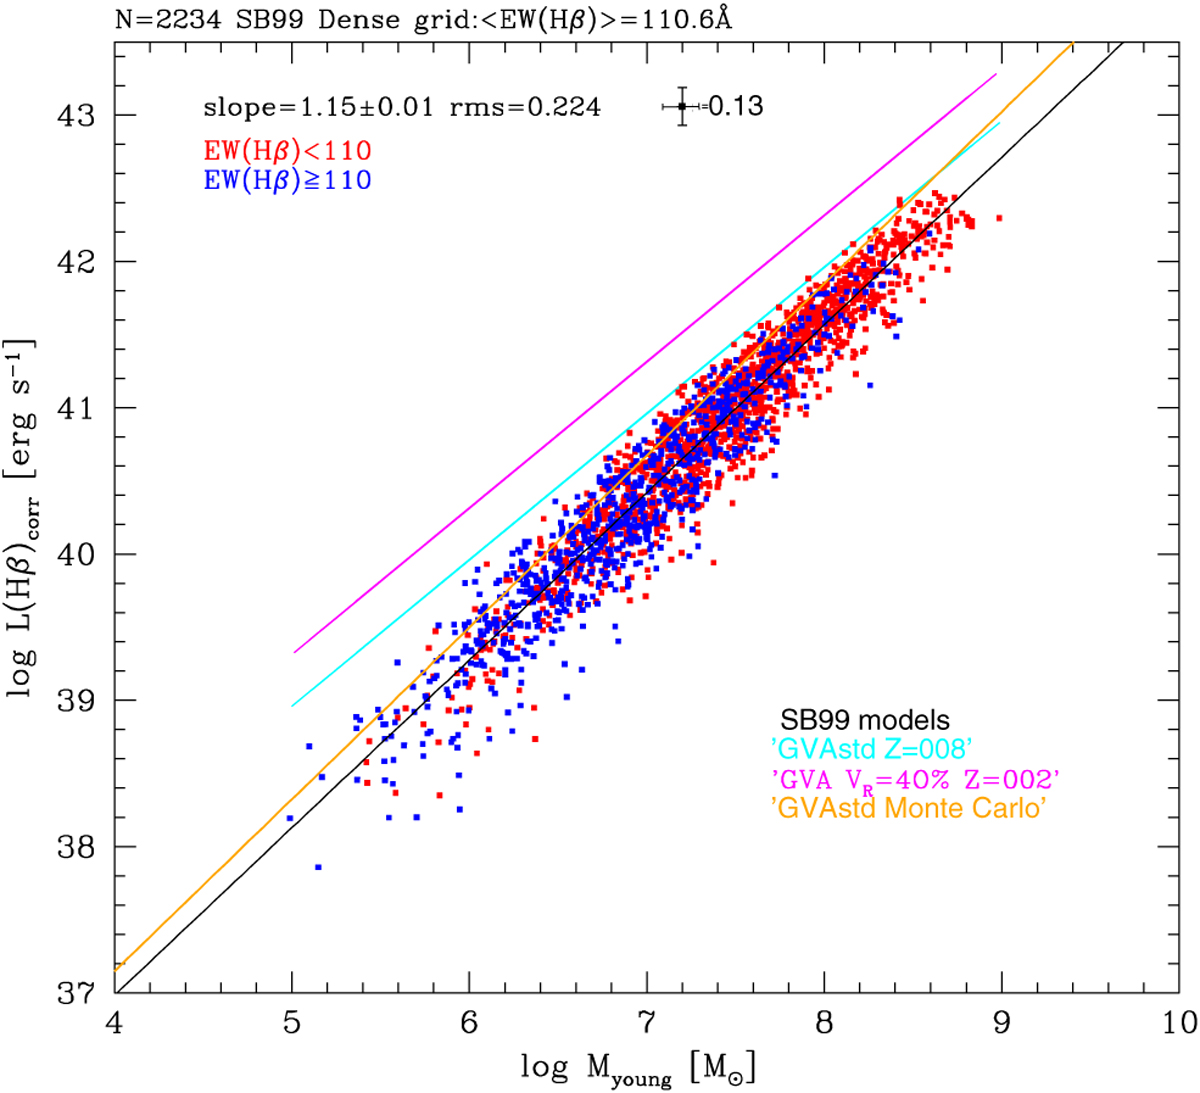
Relation between young stellar mass from CIGALE (Myoung) and Hβ luminosity at a fiducial age of 3.8 Myr. As in Fig. 9, the sample was split into two groups according to the corrected equivalent widths. We show in red objects with less than the average of the sample (110 Å) and in blue objects with higher values. The colored lines show the predictions of SB99 models for two different stellar models as indicated in the figure. The orange line corresponds to the Monte Carlo sampling discussed in the text.
Current usage metrics show cumulative count of Article Views (full-text article views including HTML views, PDF and ePub downloads, according to the available data) and Abstracts Views on Vision4Press platform.
Data correspond to usage on the plateform after 2015. The current usage metrics is available 48-96 hours after online publication and is updated daily on week days.
Initial download of the metrics may take a while.