Fig. 1
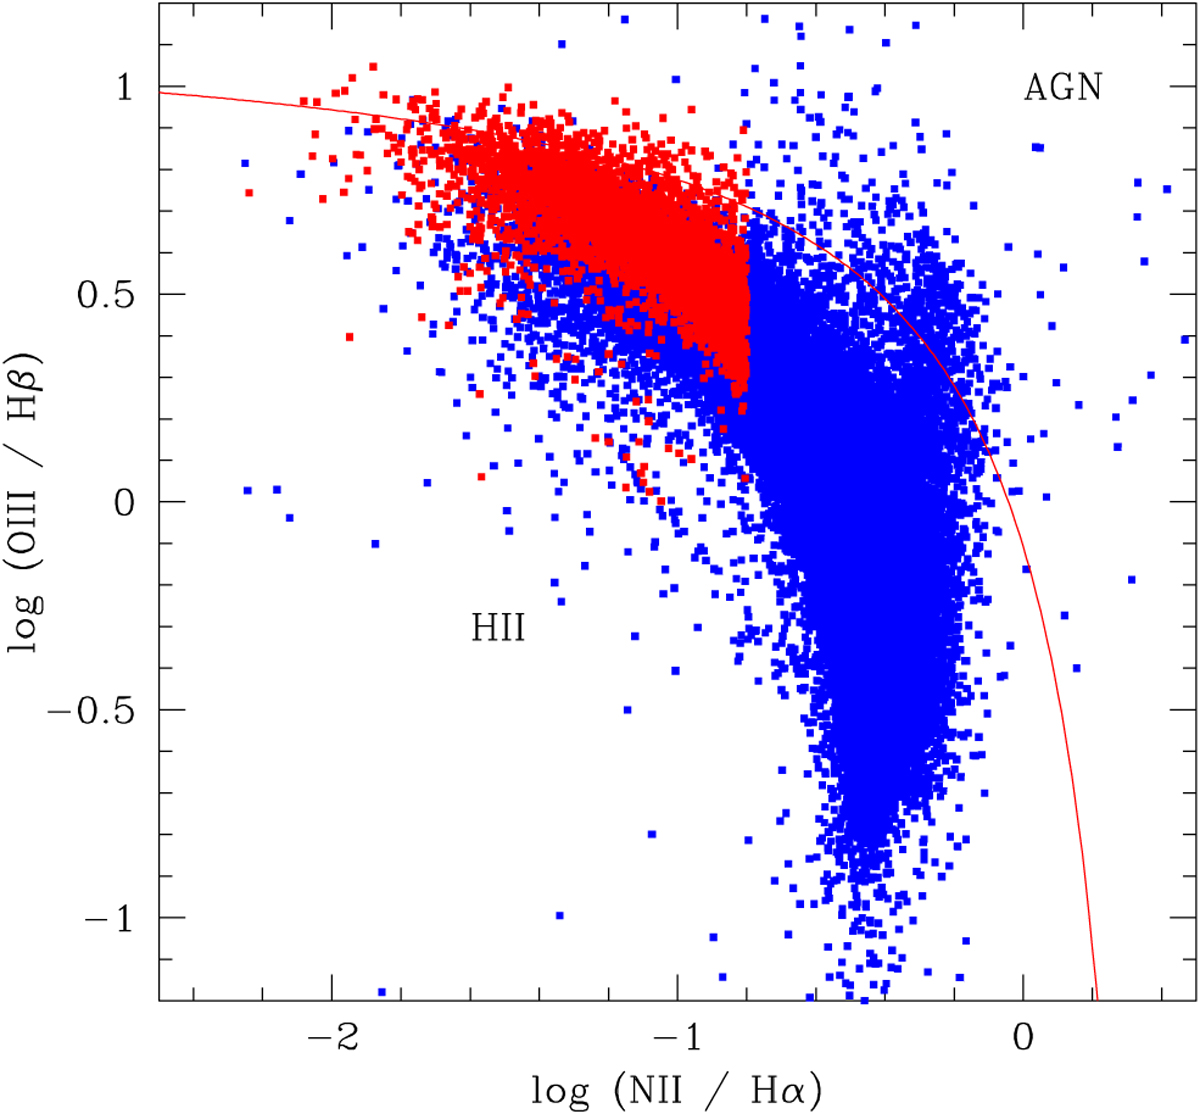
BPT diagram of the selected objects. The blue points are the whole sample of 67 000 starburst galaxies. The red points are the resulting spectroscopic sample of ~4200 galaxies with the criteria given in Table 1. HII galaxies lie below and to the left of the Kauffmann et al. (2003) classification (solid red line) that distinguishes AGNs from star-forming galaxies.
Current usage metrics show cumulative count of Article Views (full-text article views including HTML views, PDF and ePub downloads, according to the available data) and Abstracts Views on Vision4Press platform.
Data correspond to usage on the plateform after 2015. The current usage metrics is available 48-96 hours after online publication and is updated daily on week days.
Initial download of the metrics may take a while.