Fig. A.1
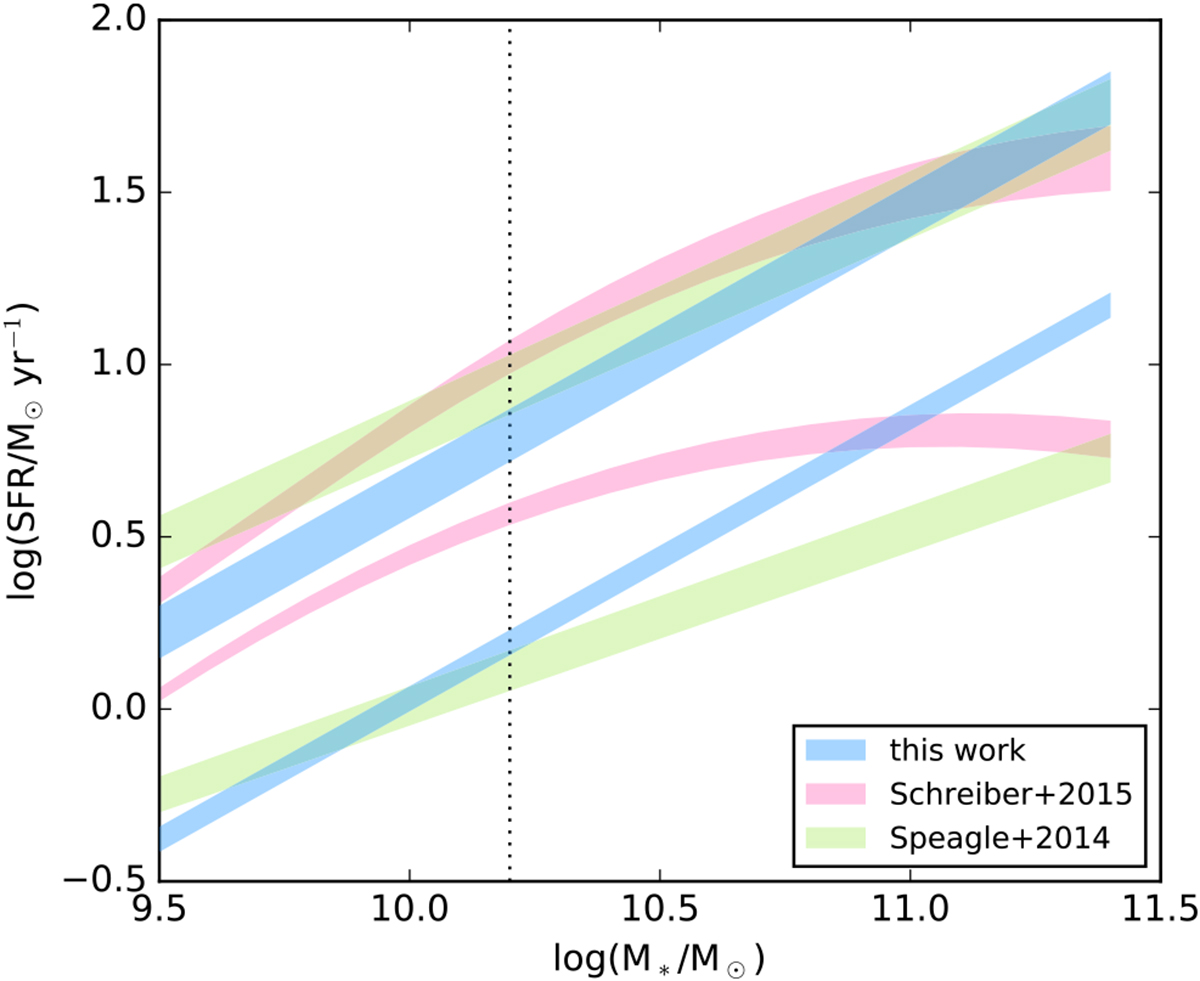
Main sequence relations at our two redshift slices. For our analysis we adopt the MS given by Eq. (9) (blue), but we also compare to MS relations with a shallower slope, (Speagle et al. 2014; green) and a MS relation with a turn-over at low redshifts and high stellar masses, Schreiber et al. (2015). The vertical dotted line at log (M* ∕M⊙) = 10.2 shows the mass cut used in this work. We note that the Speagle et al. (2014) and Schreiber et al. (2015) relations shown for comparison were not calibrated at z = 0.
Current usage metrics show cumulative count of Article Views (full-text article views including HTML views, PDF and ePub downloads, according to the available data) and Abstracts Views on Vision4Press platform.
Data correspond to usage on the plateform after 2015. The current usage metrics is available 48-96 hours after online publication and is updated daily on week days.
Initial download of the metrics may take a while.