Fig. 7
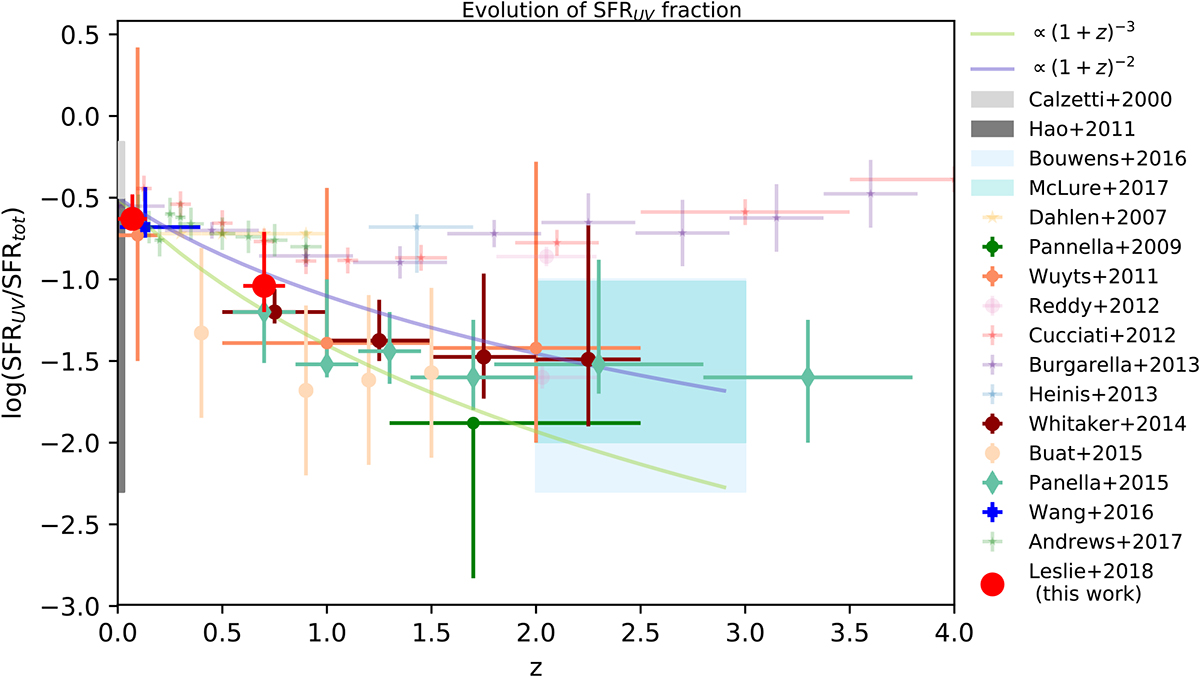
Evolution of SFRUV/SFRtot for statistical samples of galaxies at z < 4. SFRtot is the sum of the attenuated (SFRIR) and non-attenuated (SFRUV) emission. Studies that included mass-dependent measurements are Wuyts et al. (2011b), Pannella et al. (2009, 2015), Whitaker et al. (2014), McLure et al. (2018), and Bouwens et al. (2016). For these studies, the error-bars show the range of SFRUV /SFRtot for galaxies with stellar masses 10.2 < log(M*∕M⊙) < 11.4, to match the sample of massive galaxies used in this work. Bouwens et al. (2016) and McLure et al. (2018) combined literature results and are shown as shaded areas. Studies that include less-massive galaxies (shown with transparent symbols) have, on average, less attenuated UV emission, so the SFRUV /SFRtot ratio is higher. The red dots show the value of SFRUV/SFRMS we obtained for a disk galaxy inclined at 1 − cos(i) = 0.5 (i = 60 deg). More information about the studies included in this figure is provided in Appendix C. To convert the y-axis to AFUV we multiply by −2.5. Two solid lines show evolution of SFRUV/SFRtot between ![]() (purple) and
(purple) and ![]() (lime green) normalised to −0.5 at z = 0. The evolution of FUV attenuation for massive galaxies evolves as
(lime green) normalised to −0.5 at z = 0. The evolution of FUV attenuation for massive galaxies evolves as ![]() up to z ~ 2.
up to z ~ 2.
Current usage metrics show cumulative count of Article Views (full-text article views including HTML views, PDF and ePub downloads, according to the available data) and Abstracts Views on Vision4Press platform.
Data correspond to usage on the plateform after 2015. The current usage metrics is available 48-96 hours after online publication and is updated daily on week days.
Initial download of the metrics may take a while.