Fig. 6
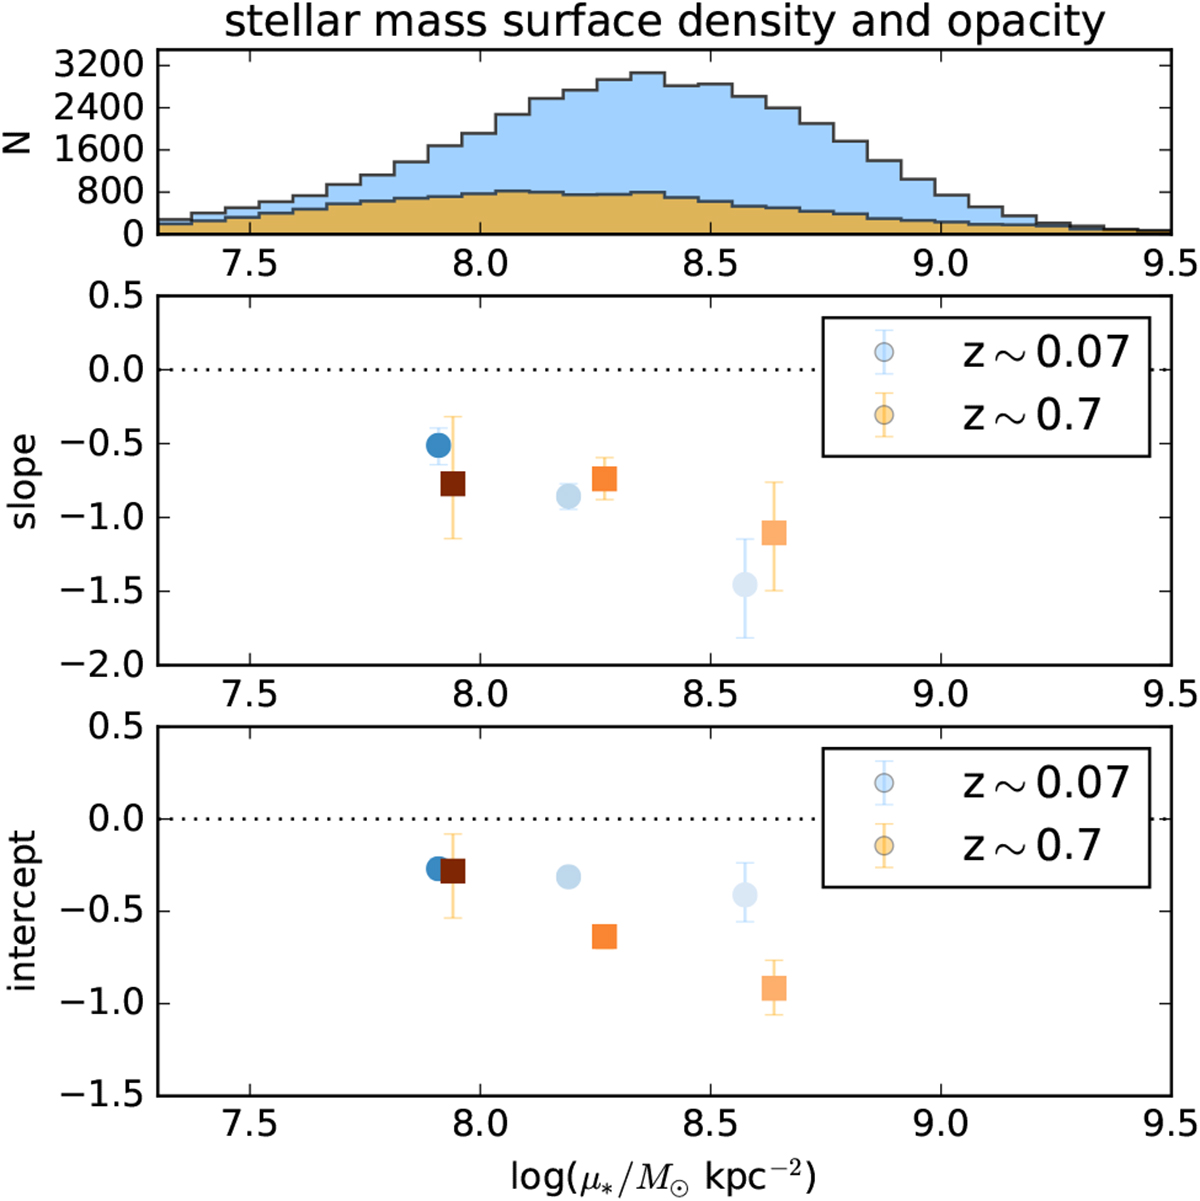
Top panel: distribution of stellar mass surface densities, μ*, for our two redshift ranges. Middle panel: relation between opacity, represented by the slope of the SFRFUV-inclination relation, and stellar mass surface density. Bottom panel: relation between overall UV attenuation, represented by the intercept of the SFRFUV-inclination relation, andμ*. Data are colour-coded by the median size, r1∕2, of each bin in the bottom panel, with colours ranging from 4 kpc (light) to 7 kpc (dark).
Current usage metrics show cumulative count of Article Views (full-text article views including HTML views, PDF and ePub downloads, according to the available data) and Abstracts Views on Vision4Press platform.
Data correspond to usage on the plateform after 2015. The current usage metrics is available 48-96 hours after online publication and is updated daily on week days.
Initial download of the metrics may take a while.