Fig. 5
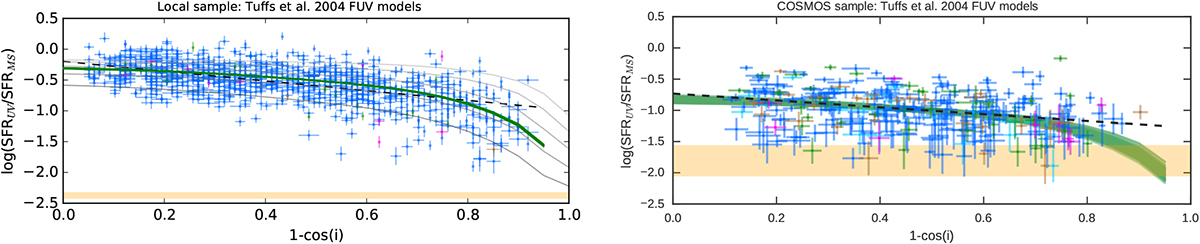
SFRUV-inclination relation shown in the top panels of Fig. 3, but with the attenuation curves of Tuffs et al. (2004) showing the expected change in flux, and hence SFRUV, with inclination. Green trends show the relations that best fit our data, with ![]() and
and ![]() for the local sample (left) and
for the local sample (left) and ![]() ,
,![]() for the COSMOS sample (right). In the left panel, models shown have face-on B-band opacities of
for the COSMOS sample (right). In the left panel, models shown have face-on B-band opacities of ![]() , 1.0, 2.0, 4.0, and 8.0 (from light to dark grey) and F = 0.22.
, 1.0, 2.0, 4.0, and 8.0 (from light to dark grey) and F = 0.22.
Current usage metrics show cumulative count of Article Views (full-text article views including HTML views, PDF and ePub downloads, according to the available data) and Abstracts Views on Vision4Press platform.
Data correspond to usage on the plateform after 2015. The current usage metrics is available 48-96 hours after online publication and is updated daily on week days.
Initial download of the metrics may take a while.