Fig. 3
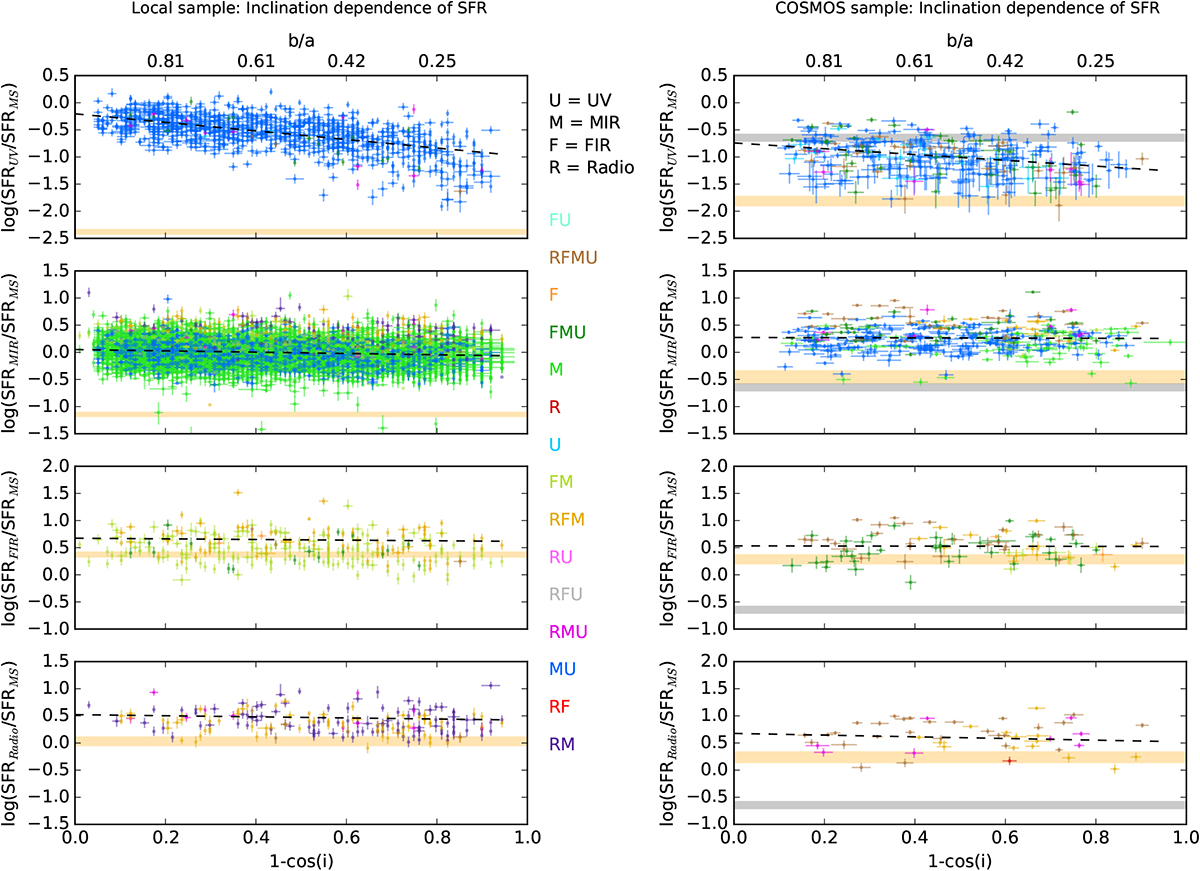
Inclination dependence of multiwavelength SFRs. y-axis: log(SFRλ) − log(SFRMS). Top to bottom: UV, MIR, FIR, and radio-determined SFR. x-axis: 1 − cos (i), where i is the galaxy inclination. Face-on galaxies are on the left of the plot (at 0) and edge-on galaxies are on the right-hand side (at 1). The left panels show SDSS galaxies (0.04 <z < 0.1) and the rightpanels show COSMOS galaxies (0.6 < z < 0.8). The colour index at the centre indicates which bands were detected; R = radio, F = FIR, M = MIR, and U = UV. The orange shaded region shows the minimum SFR that could be detected across the redshift ranges given the flux limits of the respective surveys. The dashed lines show the median best-fit obtained from 1000 realisations of the data. The grey regions on the right panels show where the local (0.04 <z < 0.1) main-sequence SFR lies with respect to the main sequence at z = 0.7. This shows how the normalisation of the main sequence evolves over our redshift range.
Current usage metrics show cumulative count of Article Views (full-text article views including HTML views, PDF and ePub downloads, according to the available data) and Abstracts Views on Vision4Press platform.
Data correspond to usage on the plateform after 2015. The current usage metrics is available 48-96 hours after online publication and is updated daily on week days.
Initial download of the metrics may take a while.