Fig. 2
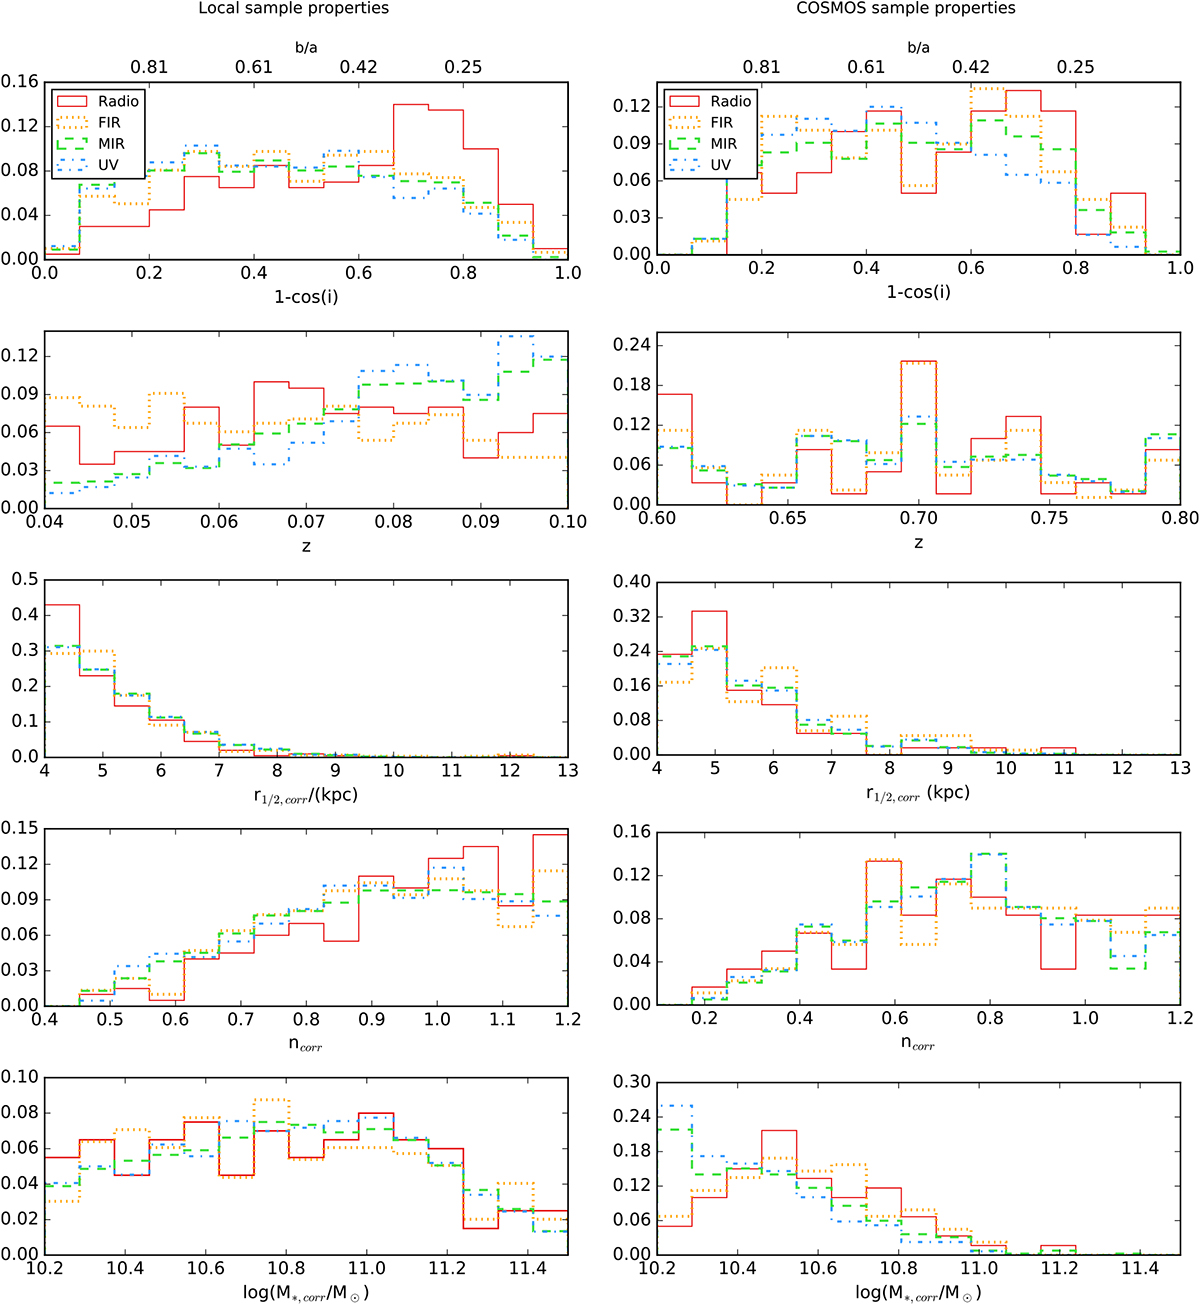
Normalised histograms of the galaxy properties of our multi-wavelength sub-samples after selection cuts. Histograms show the inclination-corrected values for r1∕2, n (derived from single Sérsic profile fits to rest-frame g-band light profiles), and log(M*). The y-axis shows the fraction of galaxies (in that subsample) in each bin. Radio-detected galaxies have a distribution of optical axis-ratios skewed towards edge-on galaxies.
Current usage metrics show cumulative count of Article Views (full-text article views including HTML views, PDF and ePub downloads, according to the available data) and Abstracts Views on Vision4Press platform.
Data correspond to usage on the plateform after 2015. The current usage metrics is available 48-96 hours after online publication and is updated daily on week days.
Initial download of the metrics may take a while.