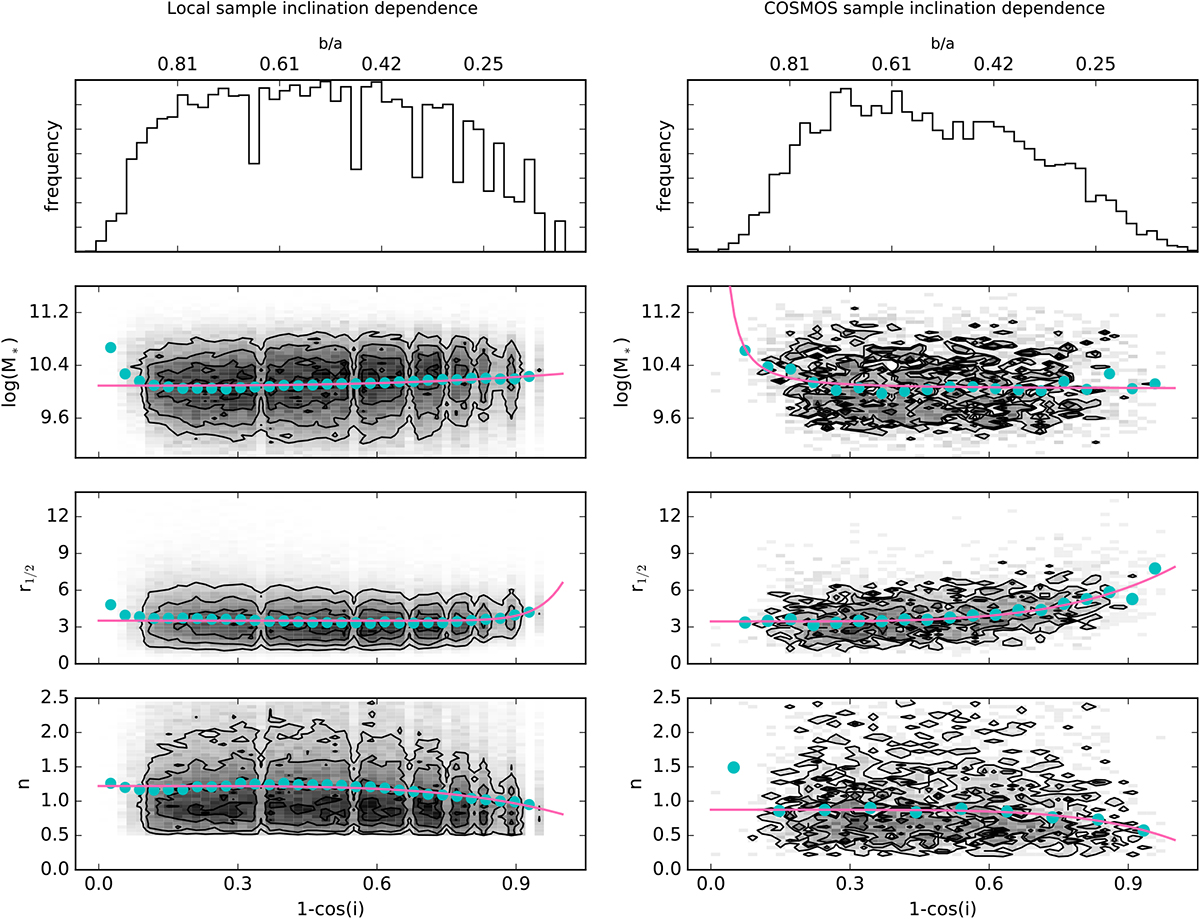
Fig. 1

Relationship between parameters used for sample selection (stellar mass M* [M⊙], half-light radius in rest-frame g-band r1∕2 [kpc], and Sérsic index n) with inclination (in the form of 1 − cos(i)). The distributions are shown for galaxies in our parent samples (see Sects. 2.1., 2.2., and 2.3). A histogram of the inclination distribution (or equivalently axis ratio distribution) is shown in the top panels. Galaxies randomly oriented would produce a flat distribution. Dips in the local b∕a distribution are caused by numerical issues in the Simard et al. (2011) fitting. Teal dots trace the median values in bins of inclination and the pink curves show the resulting power-law fit (Eq. (3)) to the medians. We subtract the inclination dependent term from our parameters before performing our final sample selection to avoid artificially introducing inclination trends in our results.
Current usage metrics show cumulative count of Article Views (full-text article views including HTML views, PDF and ePub downloads, according to the available data) and Abstracts Views on Vision4Press platform.
Data correspond to usage on the plateform after 2015. The current usage metrics is available 48-96 hours after online publication and is updated daily on week days.
Initial download of the metrics may take a while.


