Fig. 9.
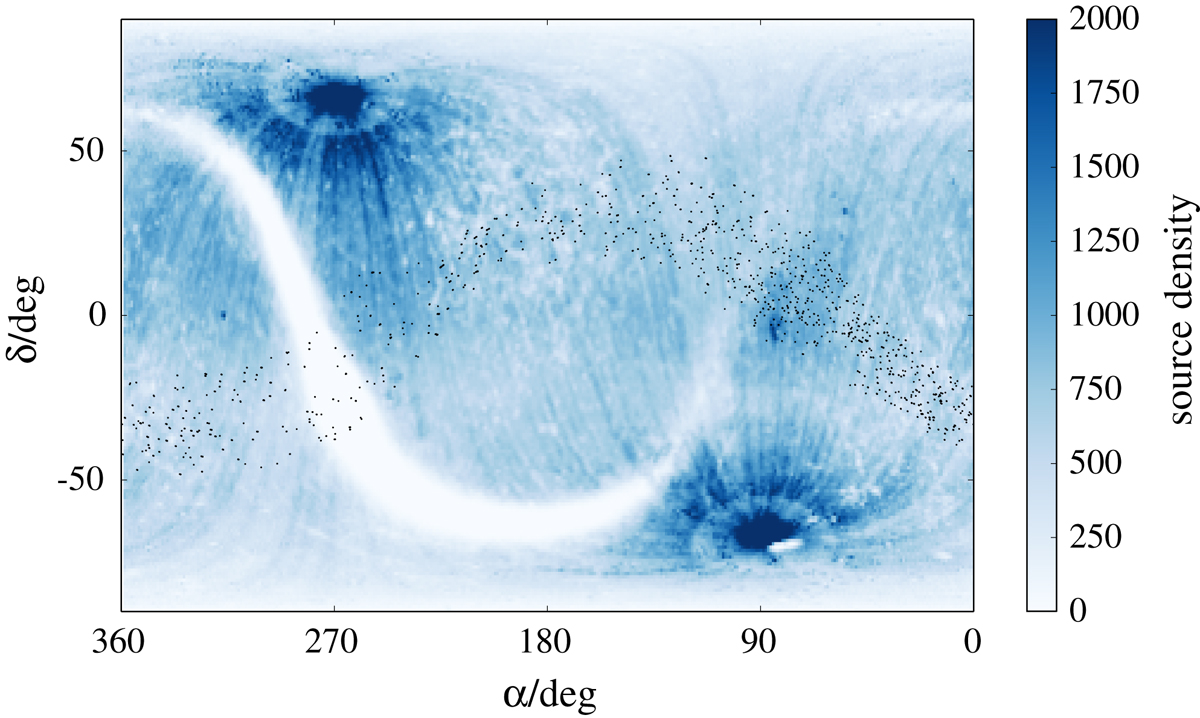
Density of detected sources (sources/deg2) of the input catalog. For clarity, the color code has been truncated at densities above 2000, since the regions at the ecliptic poles exhibit source densities almost two orders of magnitude above the average. The injected simulated Planet Nine observations are overplotted as black dots.
Current usage metrics show cumulative count of Article Views (full-text article views including HTML views, PDF and ePub downloads, according to the available data) and Abstracts Views on Vision4Press platform.
Data correspond to usage on the plateform after 2015. The current usage metrics is available 48-96 hours after online publication and is updated daily on week days.
Initial download of the metrics may take a while.