Free Access
Fig. 8.
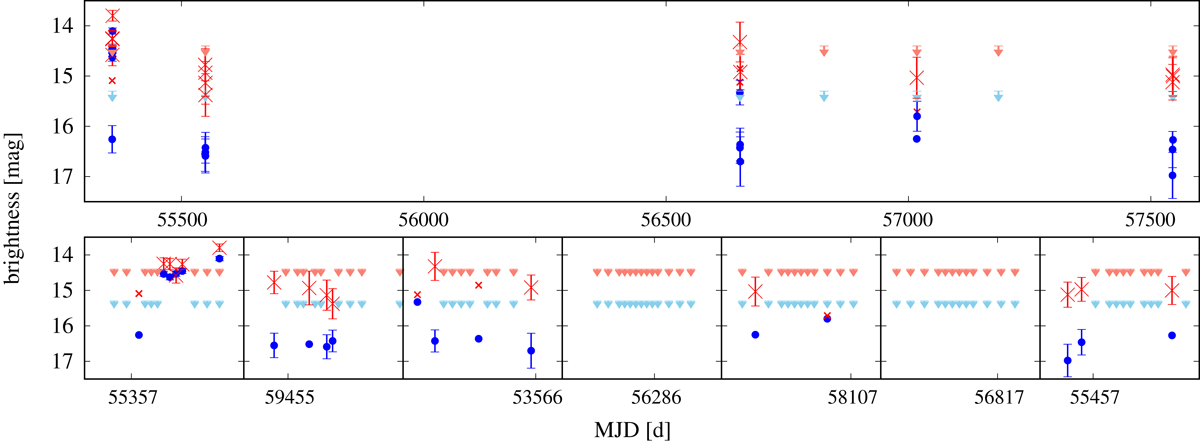
Light curve of Makemake in the WISE bands W1 (red crosses) and W2 (blue dots). The upper row shows the entire light curve, while the second row shows a zoom of the observation epochs in 1.5 d windows. Non-detections are marked with an arrow at the S/N = 5 level. We note that most detections have a S/N below 5.
Current usage metrics show cumulative count of Article Views (full-text article views including HTML views, PDF and ePub downloads, according to the available data) and Abstracts Views on Vision4Press platform.
Data correspond to usage on the plateform after 2015. The current usage metrics is available 48-96 hours after online publication and is updated daily on week days.
Initial download of the metrics may take a while.