Fig. 7
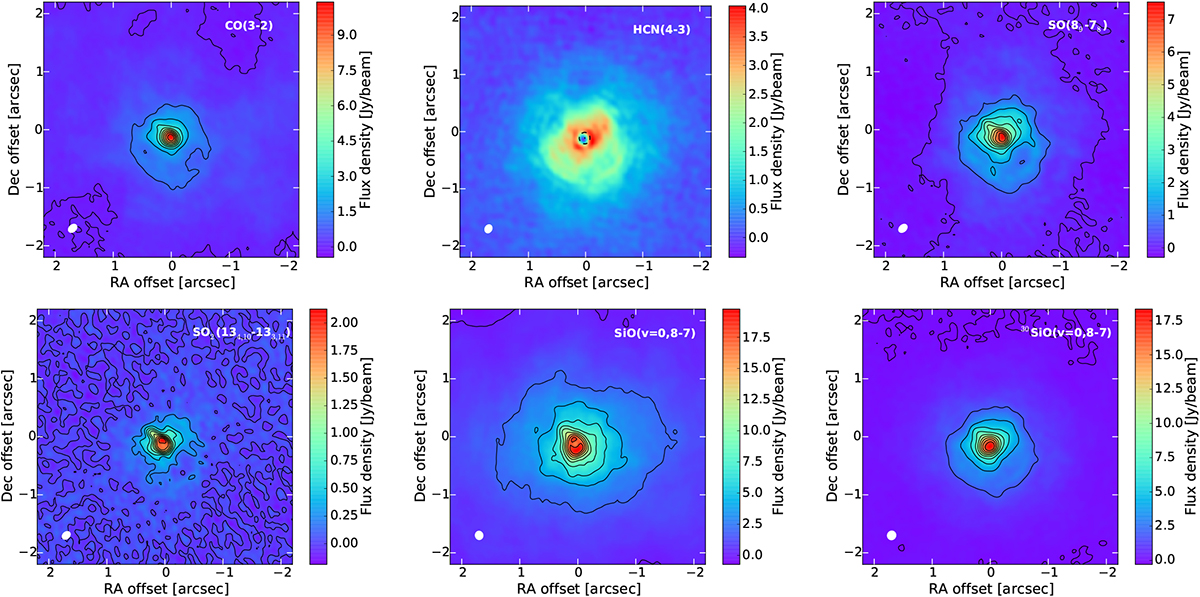
Total intensity (zeroth moment) maps for some bright lines in R Dor. For all lines, except HCN(4–3), the line contours are given, each step being 10% of the peak flux density. For HCN(4–3), we demonstrate the position of the “blue hole” by showing by showing in dotted black line the dust continuum contours at 1%, 10%, and 90% of the peak continuum emission. The contrast in the figure is best visible on screen.
Current usage metrics show cumulative count of Article Views (full-text article views including HTML views, PDF and ePub downloads, according to the available data) and Abstracts Views on Vision4Press platform.
Data correspond to usage on the plateform after 2015. The current usage metrics is available 48-96 hours after online publication and is updated daily on week days.
Initial download of the metrics may take a while.