Fig. 5
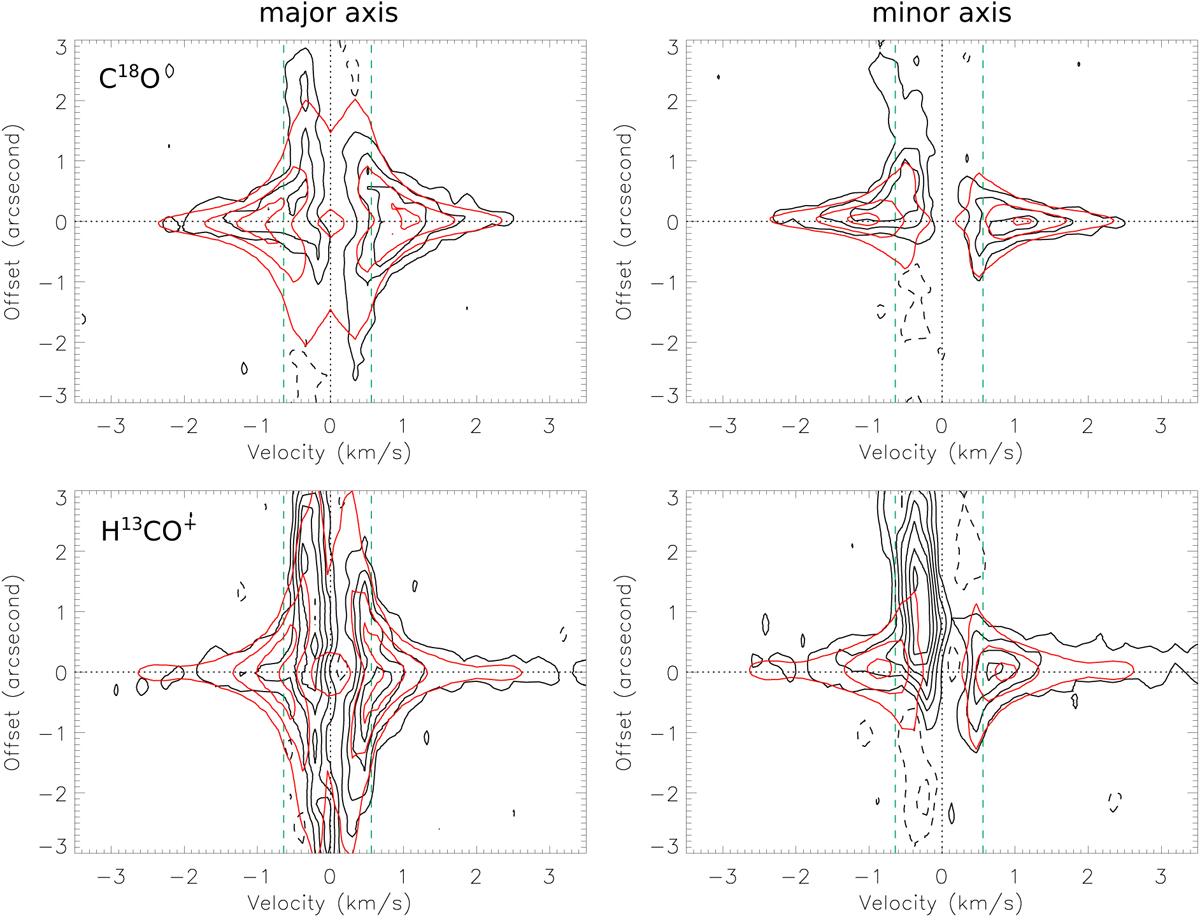
Observed (black) and best-fit model (red; with parameters in Table 1) position–velocity diagrams of the C18 O (upper panels) and H13CO+ (lower panels) emission along the major (left panels) and minor (right panels) axes of the flattened envelope passing through the protostellar position. Vertical and horizontal dotted lines denote the systemic velocity of 8.34 km s−1 and the protostellar position, respectively. Vertical green dashed lines show the velocity range that was not included in our model fitting, VLSR of 7.7–8.9 km s−1, because of a possible contamination from the outflow. Contour levels are from 3σ in steps of 5σ, where 1σ is 3.8 mJy beam−1 in the C18O emission andis 3.3 mJy beam−1 in the H13CO+ emission.
Current usage metrics show cumulative count of Article Views (full-text article views including HTML views, PDF and ePub downloads, according to the available data) and Abstracts Views on Vision4Press platform.
Data correspond to usage on the plateform after 2015. The current usage metrics is available 48-96 hours after online publication and is updated daily on week days.
Initial download of the metrics may take a while.