Fig. 3
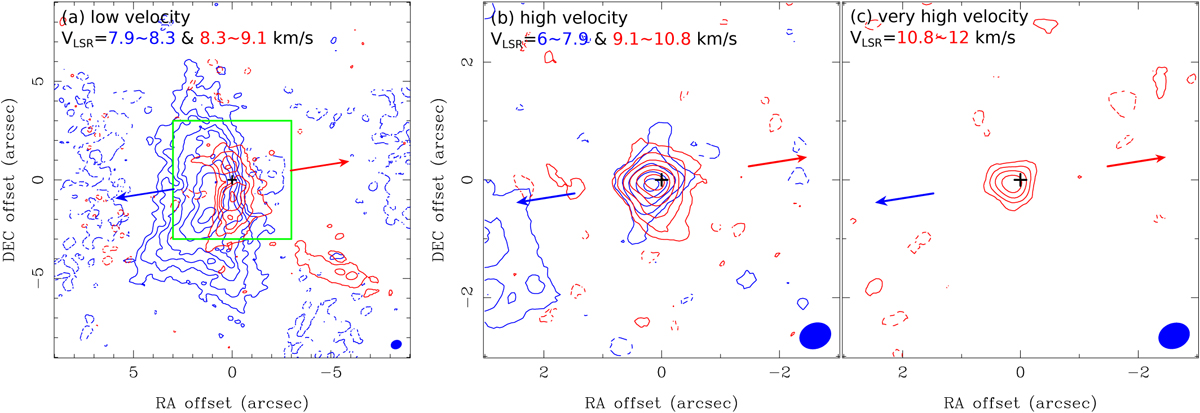
Moment 0 maps of the H13CO+ emission integrated over different velocity regimes, (a) low velocity VLSR = 7.9–8.3 and 8.3–9.1 km s−1, (b) high velocity VLSR = 6–7.9 and 9.1–10.8 km s−1, and (c) very high velocity VLSR = 10.8–12 km s−1. Blue and red contours present the blue- and redshifted emission, respectively. Crosses denote the protostellar position. Red and blue arrows show the direction of the blue- and redshifted outflows, respectively. A green box in (a) presents the image size of (b) and (c). Filled blue ellipses show the size of the synthesized beam of 0. ′′ 5 × 0. ′′ 4. Contour levels in (a) are 5σ, 10σ, 15σ, and 20σ and then in steps of 10σ, in (b) are 3σ, 6σ, 10σ, 15σ, 20σ, and 25σ and then in steps of 10σ, and in (c) are from 3σ in steps of 3σ, where 1σ is 1.1, 1.8, and 1.6 mJy beam−1 km s−1, respectively.
Current usage metrics show cumulative count of Article Views (full-text article views including HTML views, PDF and ePub downloads, according to the available data) and Abstracts Views on Vision4Press platform.
Data correspond to usage on the plateform after 2015. The current usage metrics is available 48-96 hours after online publication and is updated daily on week days.
Initial download of the metrics may take a while.