Fig. 1
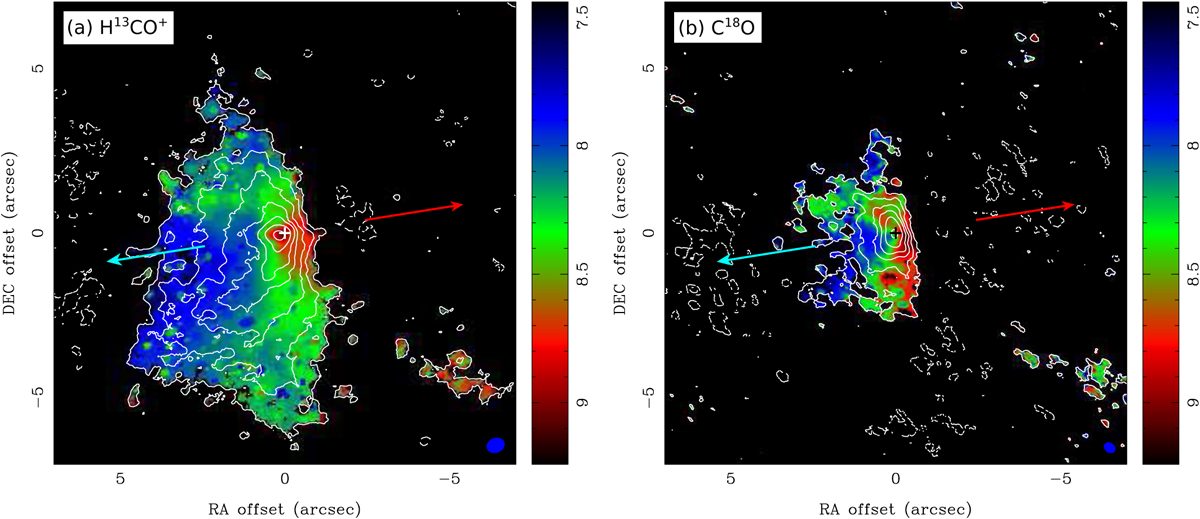
Moment 0 (contours) overlaid on moment 1 (color) maps of the (a) H13 CO+ (3–2) and (b) C18 O (2–1) emission in B335 obtained with the ALMA observations. Color scales are in units of km s−1 in the LSR frame. The color scales are the same in (a) and (b). Crosses denote the protostellar position. Red and blue arrows show the direction of the blue- and redshifted outflows, respectively. Contour levels in (a) are 3σ, 6σ, 10σ, 15σ, 20σ, 30σ, and 45σ, and in (b) are 3σ, 6σ, 10σ, 15σ, 25σ, and 40σ, where 1σ is 3.3 and 3.4 mJy beam−1 km s−1, respectively.
Current usage metrics show cumulative count of Article Views (full-text article views including HTML views, PDF and ePub downloads, according to the available data) and Abstracts Views on Vision4Press platform.
Data correspond to usage on the plateform after 2015. The current usage metrics is available 48-96 hours after online publication and is updated daily on week days.
Initial download of the metrics may take a while.