Fig. 6.
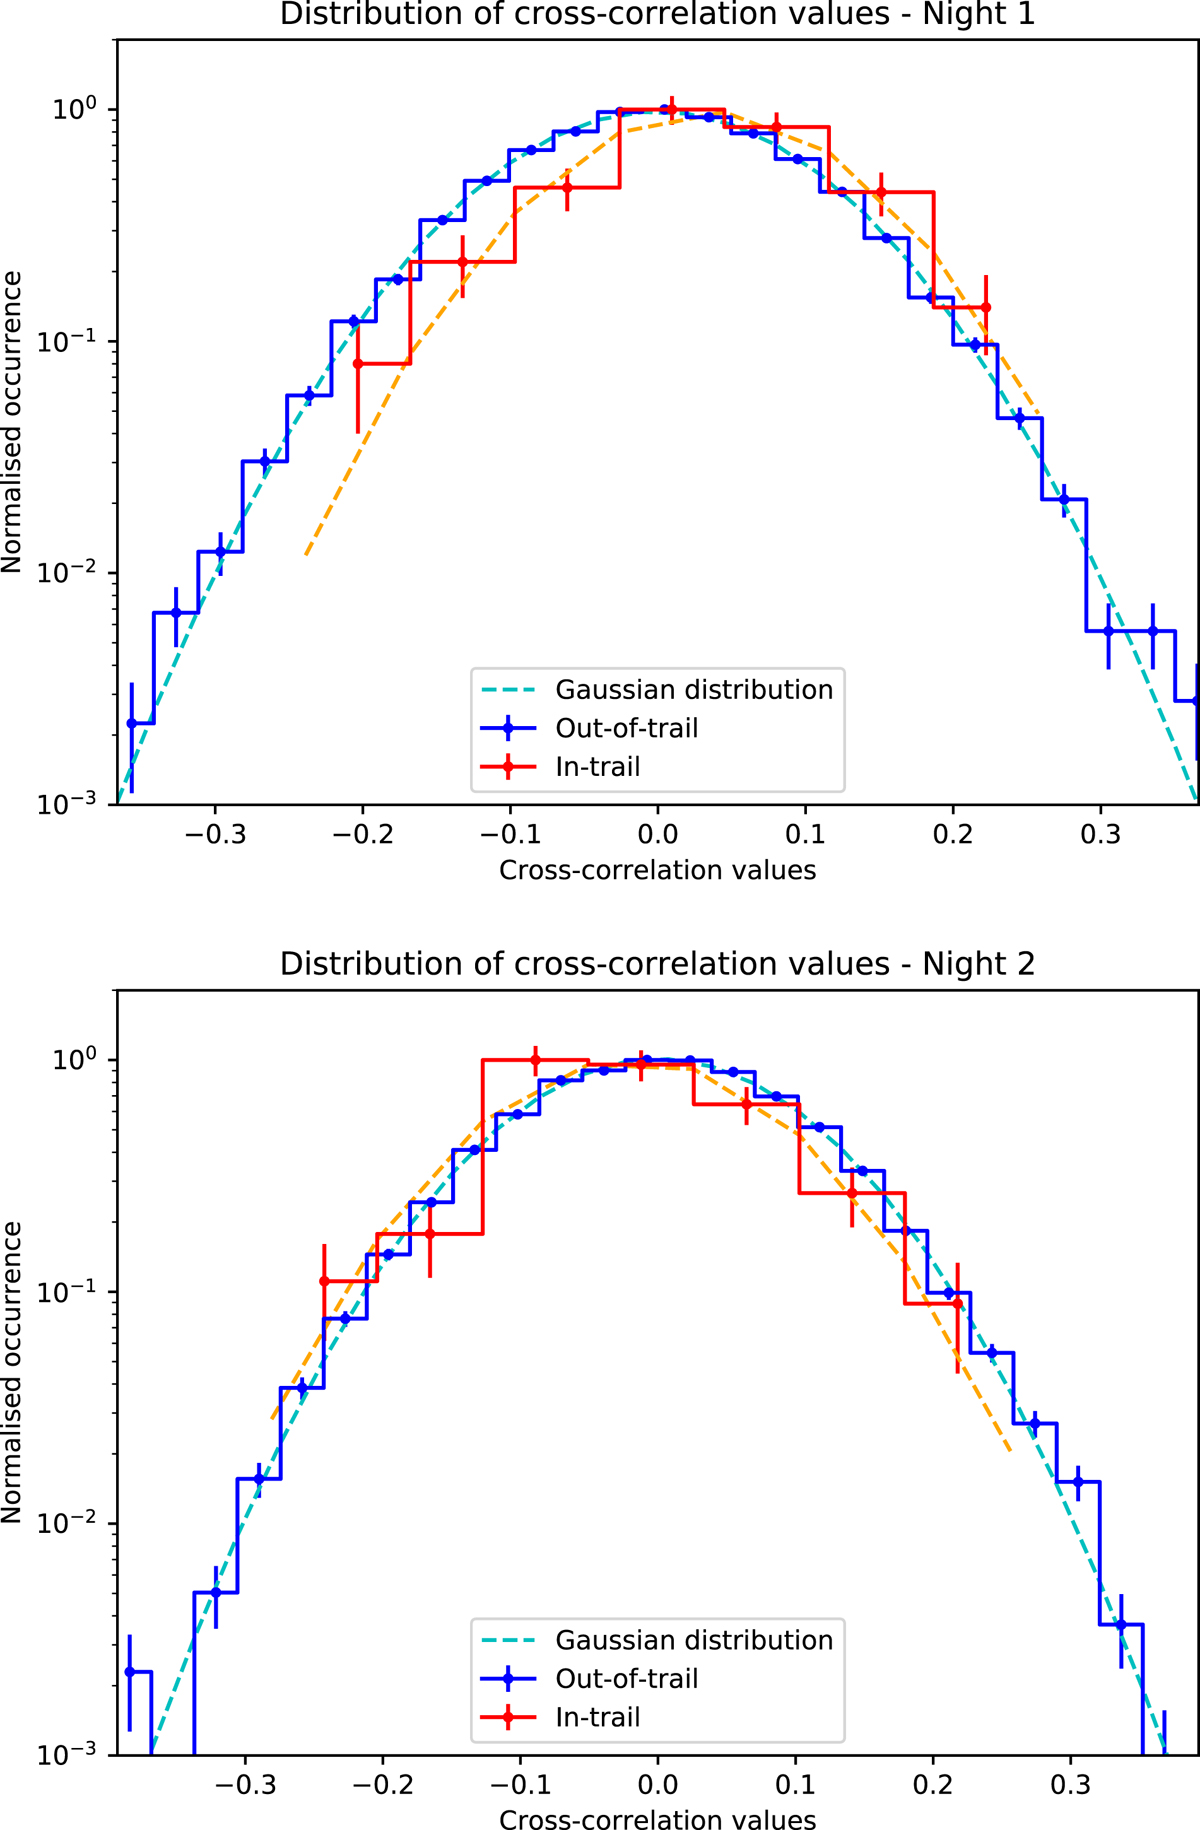
Distribution of cross-cross correlation values away from the radial velocity of HD 189 733 b (out-of-trail values, in blue), compared to a Gaussian distribution with the same sample mean and variance (dashed line, light blue). The top panel is for the first night of observations, the bottom panel for the second. In both datasets, the sample distribution shows no deviation down to approximately four times the standard deviation. For comparison, the corresponding distribution of the cross-correlation values around the planet radial velocity (in-trail) is shown in red. In the data from the first night, the two distributions appear shifted as one would expect if the planet transmission spectrum is detected. Conversely, no evident shift is detected in the data from the second night. The statistical significance of these shifts is quantified through a generalised t-test as explained in Sect. 3.3.
Current usage metrics show cumulative count of Article Views (full-text article views including HTML views, PDF and ePub downloads, according to the available data) and Abstracts Views on Vision4Press platform.
Data correspond to usage on the plateform after 2015. The current usage metrics is available 48-96 hours after online publication and is updated daily on week days.
Initial download of the metrics may take a while.