Fig. 5.
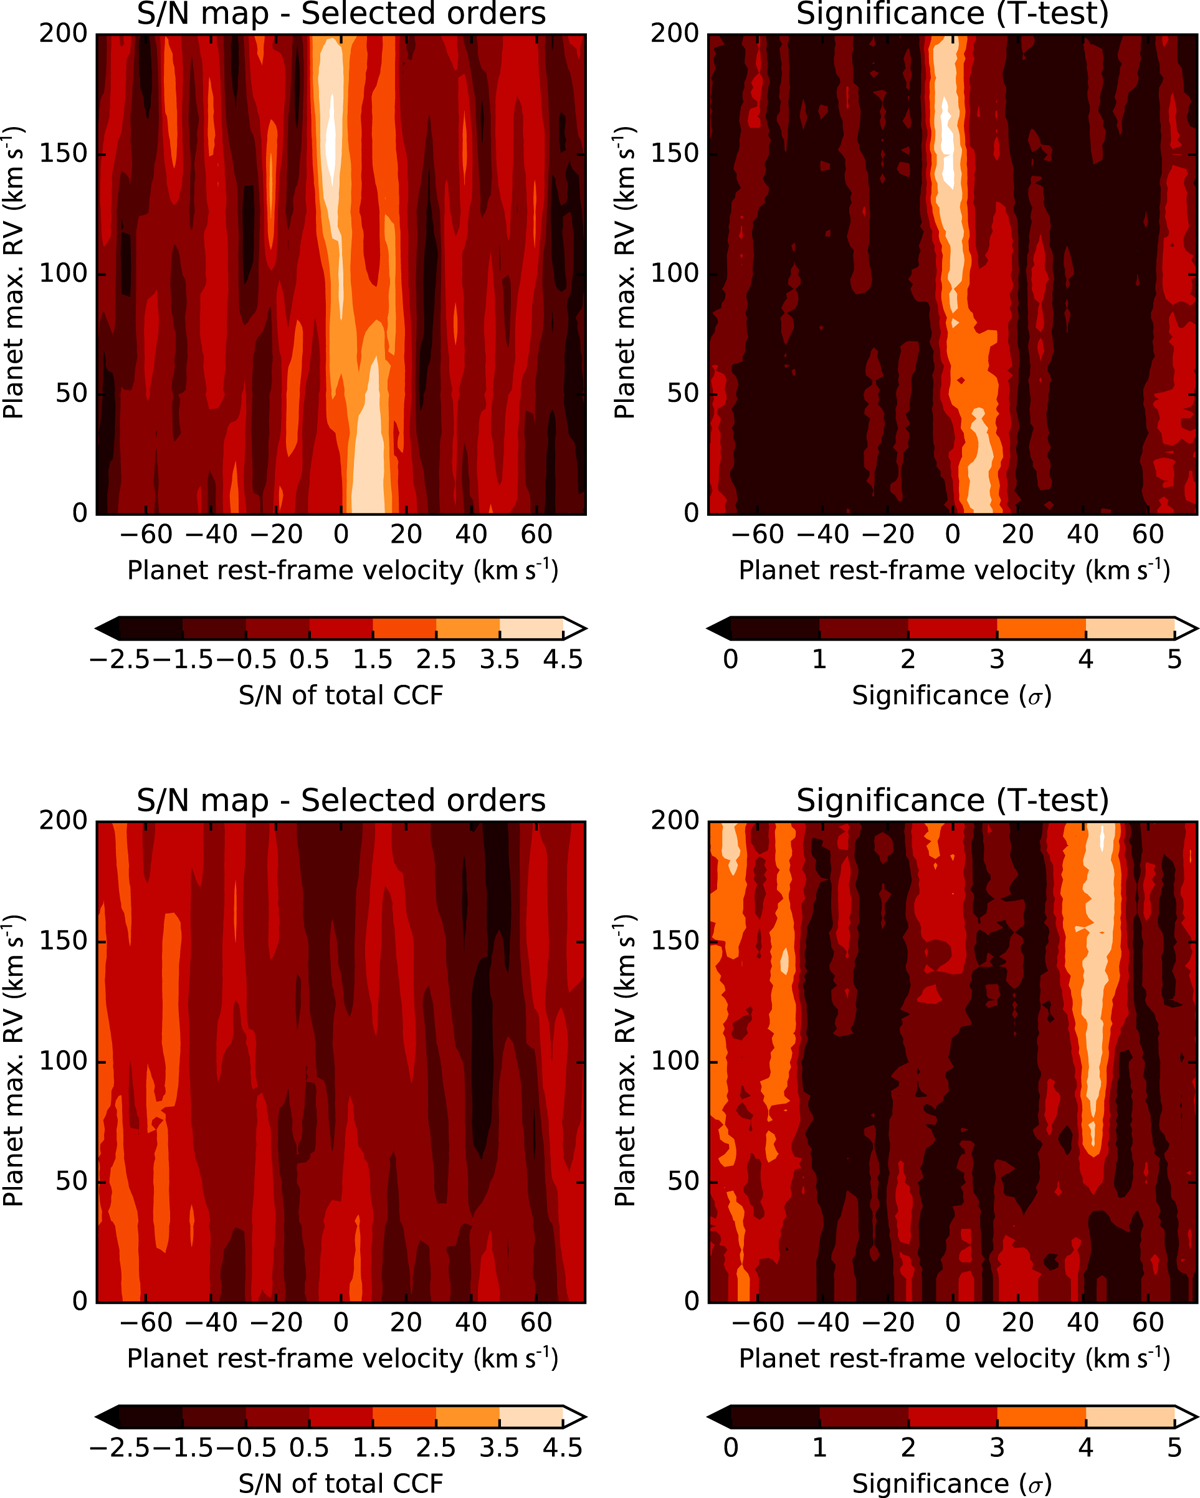
Detection of H2O in the transmission spectrum of HD 189 733 b observed on July 11, 2015 (top panels) and the non detection on the night of July 30, 2015 (bottom panels). The total cross-correlation signal is shown as function of rest-frame velocity νrest and planet radial velocity semi-amplitude KP. The measured S/N and corresponding significances are shown in the left and right panels, respectively. These are computed as explained in Sect. 3.3. The cross-correlation shown here is obtained with a model spectrum containing H2O at VMR = 10−4 and CH4 at VMR = 10−12.
Current usage metrics show cumulative count of Article Views (full-text article views including HTML views, PDF and ePub downloads, according to the available data) and Abstracts Views on Vision4Press platform.
Data correspond to usage on the plateform after 2015. The current usage metrics is available 48-96 hours after online publication and is updated daily on week days.
Initial download of the metrics may take a while.