Fig. 1.
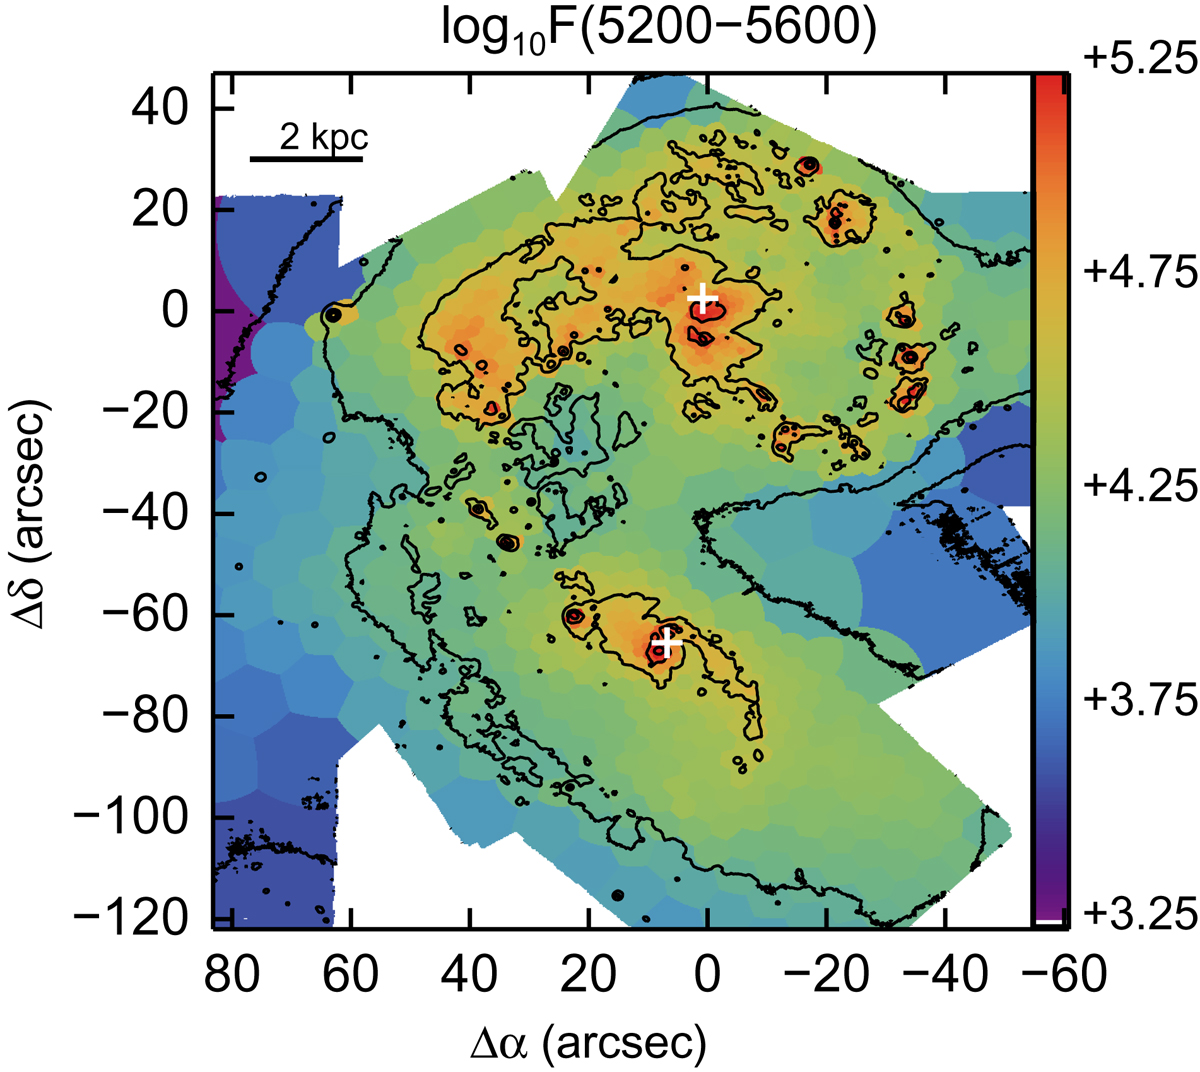
Line-free continuum as derived from STARLIGHT showing the mapped area with the tessellated pattern used to extract the high signal-to-noise ratio spectra (i.e. the tiles). The reconstructed white-light image is overplotted as reference with contours in logarithmic stretching of 0.5 dex steps. The origin of coordinates here and through the paper was put at the position of the northern nucleus. North is up, east is to the left.
Current usage metrics show cumulative count of Article Views (full-text article views including HTML views, PDF and ePub downloads, according to the available data) and Abstracts Views on Vision4Press platform.
Data correspond to usage on the plateform after 2015. The current usage metrics is available 48-96 hours after online publication and is updated daily on week days.
Initial download of the metrics may take a while.