Fig. C.1.
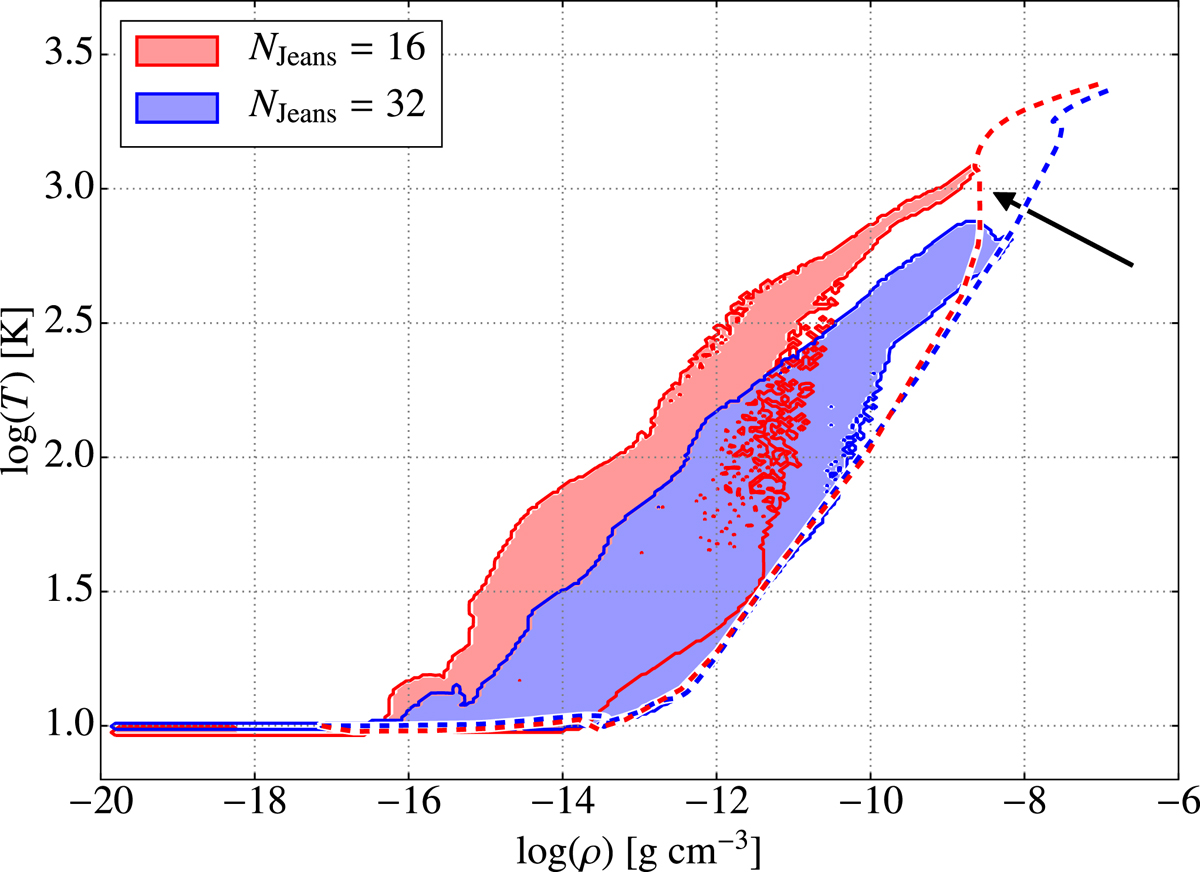
Temperature as a function of density, for every cell in the computational domain (ideal MHD case). The simulation using NJeans = 32 cells per Jeans length is represented by the blue area, while the red region is for the run with only 16 cells per Jeans length. Each data set is delineated by a solid contour line which outlines the data distributions. The two snapshots were taken at similar evolution times, chosen to be just after the NJeans = 16 run has departed from its initial adiabatic track. The dashed lines represent the time evolution of the central (densest) cell inside the mesh (these tracks continue beyond the time of the snapshots to provide a wider context). The black arrow indicates the place where the low-resolution track departs from its original adiabat.
Current usage metrics show cumulative count of Article Views (full-text article views including HTML views, PDF and ePub downloads, according to the available data) and Abstracts Views on Vision4Press platform.
Data correspond to usage on the plateform after 2015. The current usage metrics is available 48-96 hours after online publication and is updated daily on week days.
Initial download of the metrics may take a while.