Fig. B.1.
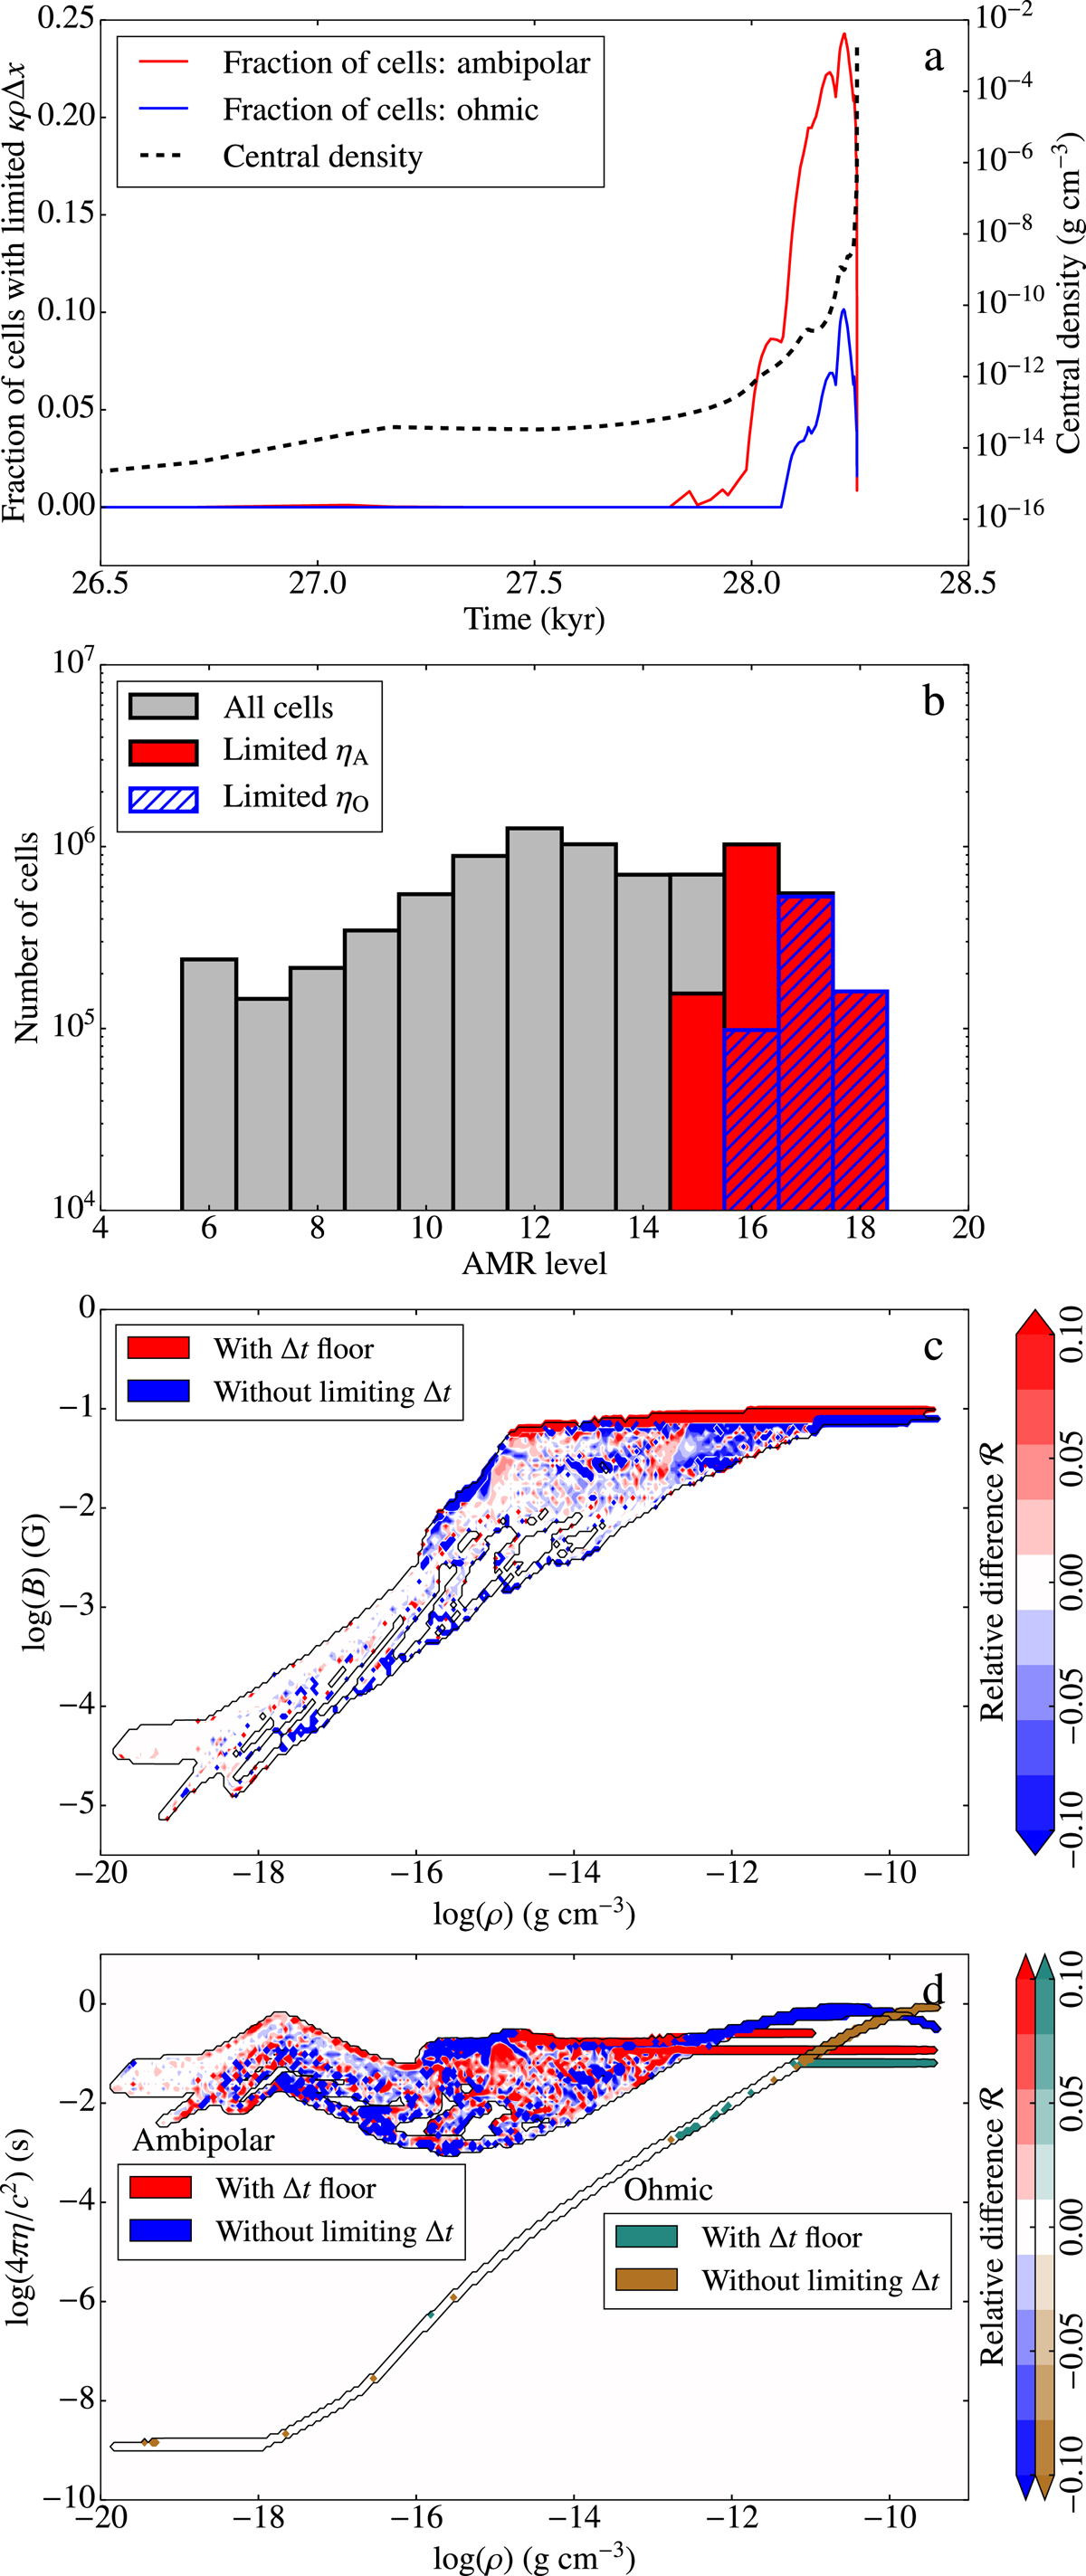
Panel a: fraction of cells inside the mesh where ηA (red) and ηO(blue) are being modified to prevent the MHD timestep from becoming too small, as a function of time. The dashed black line shows the evolution of the central density. Panel b: number of cells per AMR level (grey) and the number of cells where the ambipolar (red) and ohmic (blue hatched) diffusion timestep floor is operating, at a time of 28.2 kyr. Panel c: relative difference in 2D histograms of magnetic field strength as a function of density for all the cells in a simulation with Δt flooring and a second simulation without, at t = 28.2 kyr. The colour scale is analogous to that of Fig. A.1. Panel d: same as panel c but in the case of the ambipolar (red-blue) and ohmic (green-brown) resistivities.
Current usage metrics show cumulative count of Article Views (full-text article views including HTML views, PDF and ePub downloads, according to the available data) and Abstracts Views on Vision4Press platform.
Data correspond to usage on the plateform after 2015. The current usage metrics is available 48-96 hours after online publication and is updated daily on week days.
Initial download of the metrics may take a while.