Fig. A.1.
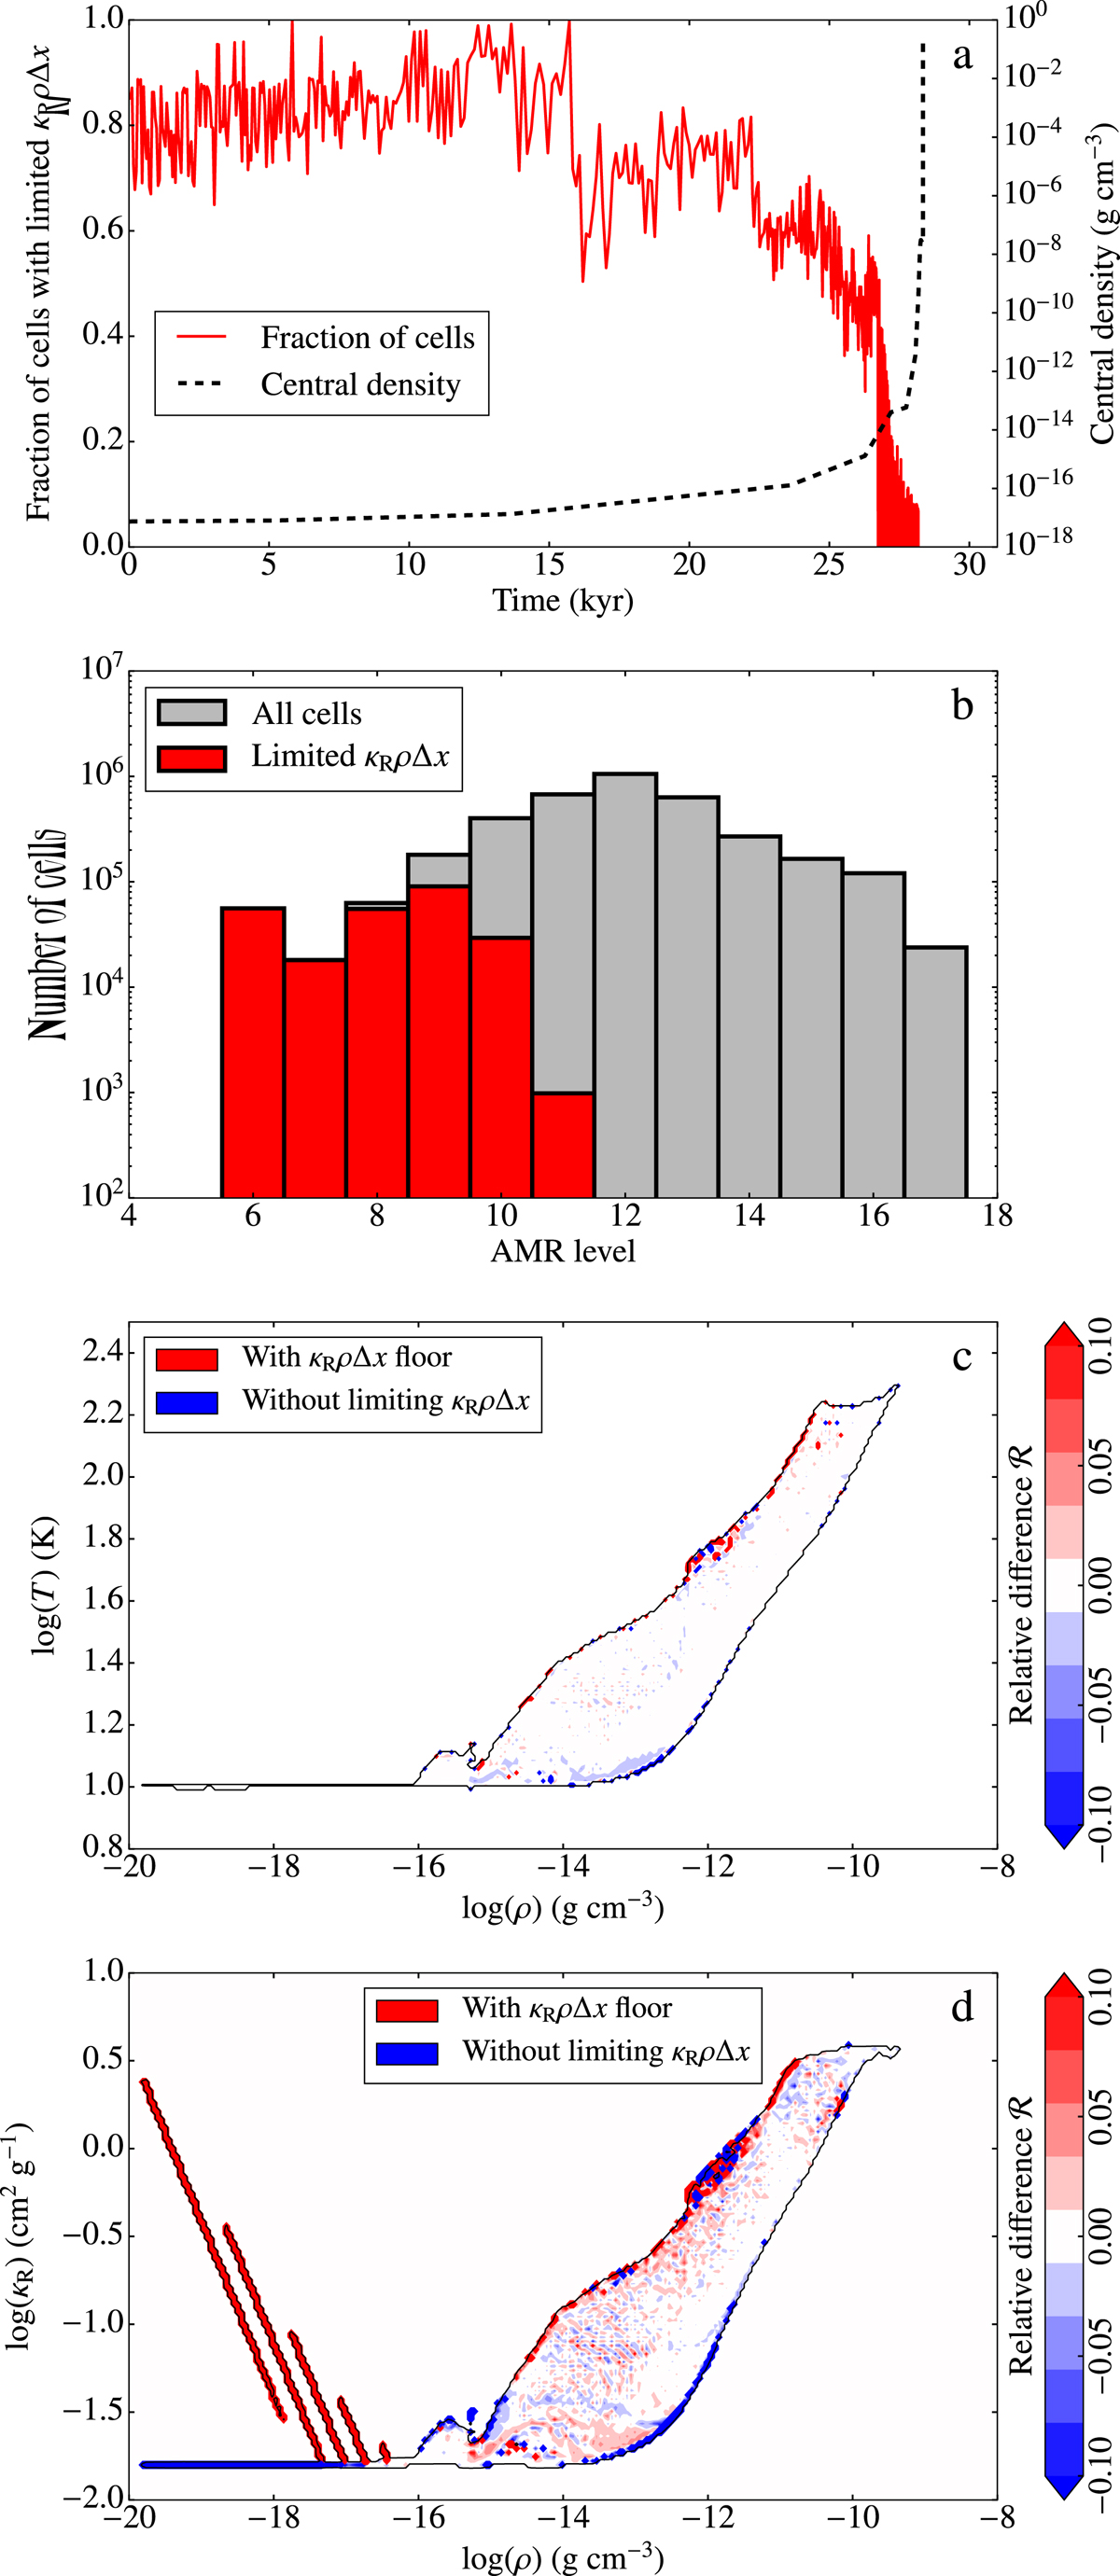
Panel a: fraction of cells inside the mesh where the optical depth is being limited as a function of time (red solid line). The dashed black line shows the density at the centre of the system as a function of time. Panel b: number of cells in each level (grey) and the number of cells where the optical depth floor is operating (red), at a time of 28.180 kyr, when the first Larson core is formed. Panel c: relative difference in 2D histograms of gas temperature as a function of density for all the cells in a simulation with optical depth limitation and a second simulation without, at t = 28.180 kyr. The colour scale gives a measure of ℛ = Nlimited/Nnot limited − 1, where N… is the number of cells binned inside a (ρ, T) pixel for the two different simulations. Panel d: same as panel c but in the case of the Rosseland mean opacity as a function of density.
Current usage metrics show cumulative count of Article Views (full-text article views including HTML views, PDF and ePub downloads, according to the available data) and Abstracts Views on Vision4Press platform.
Data correspond to usage on the plateform after 2015. The current usage metrics is available 48-96 hours after online publication and is updated daily on week days.
Initial download of the metrics may take a while.