Fig. 6.
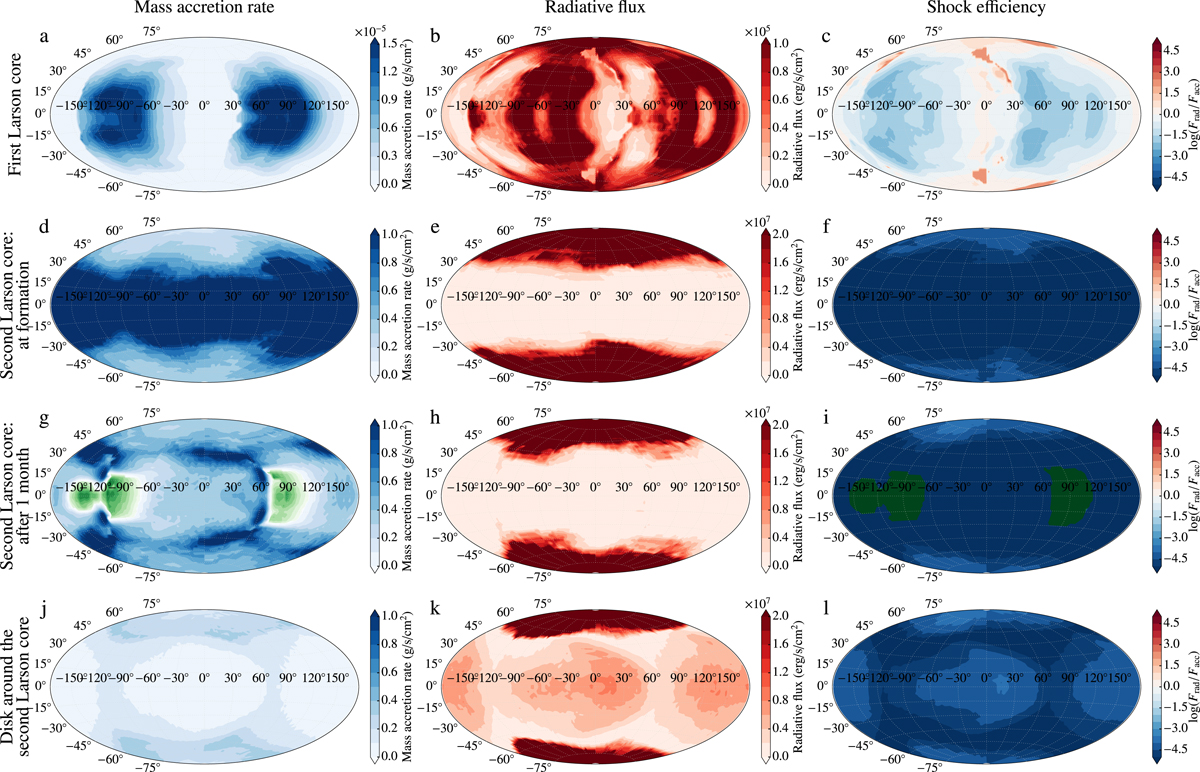
Hammer projections (runAO only) of the mass accretion rate (left column), the radiative flux (middle column), and the ratio of radiative to accretion flux (right column). The first row is for the first Larson core, while the second row shows the second Larson core just after its formation. The third and fourth rows show the second Larson core 24 days after formation and the accretion flow at the edge of the disk around the second hydrostatic core, respectively. The green colours in panels g and i indicate negative values.
Current usage metrics show cumulative count of Article Views (full-text article views including HTML views, PDF and ePub downloads, according to the available data) and Abstracts Views on Vision4Press platform.
Data correspond to usage on the plateform after 2015. The current usage metrics is available 48-96 hours after online publication and is updated daily on week days.
Initial download of the metrics may take a while.