Fig. 5.
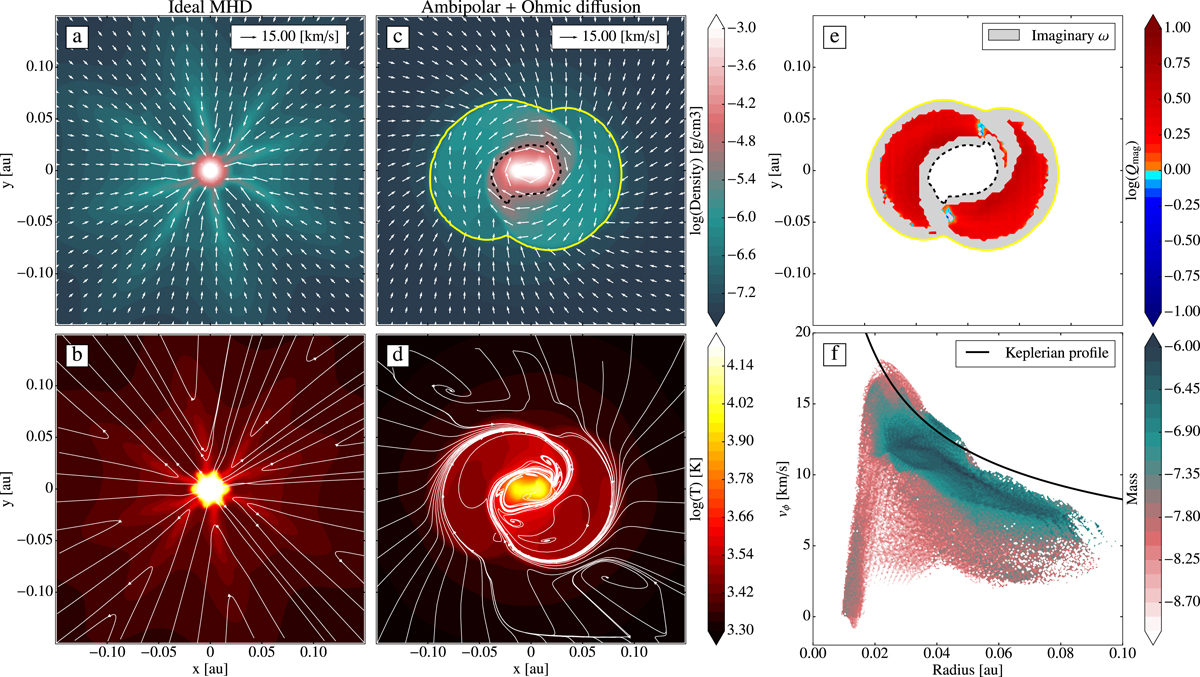
Slices of the gas density with velocity vectors in runID (panel a) and runAO panel c, about one month after the formation of the second Larson core. The area shown is the same as in Figs. 3s and 3t. In panel c, the yellow contour marks the disk limit, taken as ρ > 10−6.7 g cm−3, while the black dashed contour delineates the second hydrostatic core with ρ > 10−5 g cm−3. Panels b and d: slices of the gas temperature with magnetic field streamlines overlayed. Panel e: logarithmic map of the magnetic Toomre stability criterion Q mag inside the disk that forms around the second core in runAO. The grey-shaded areas indicate regions in the disk where the epicyclic frequency ω is imaginary and no Q could be computed. The yellow and dashed black contours are the same as in panel c. Panel f : radial profile of the azimuthal velocity for all the cells inside the runAO second core disk. The colours code for the mass contained in a particular region of the plot. A Keplerian velocity profile is overlayed (black solid line).
Current usage metrics show cumulative count of Article Views (full-text article views including HTML views, PDF and ePub downloads, according to the available data) and Abstracts Views on Vision4Press platform.
Data correspond to usage on the plateform after 2015. The current usage metrics is available 48-96 hours after online publication and is updated daily on week days.
Initial download of the metrics may take a while.