Fig. 4.
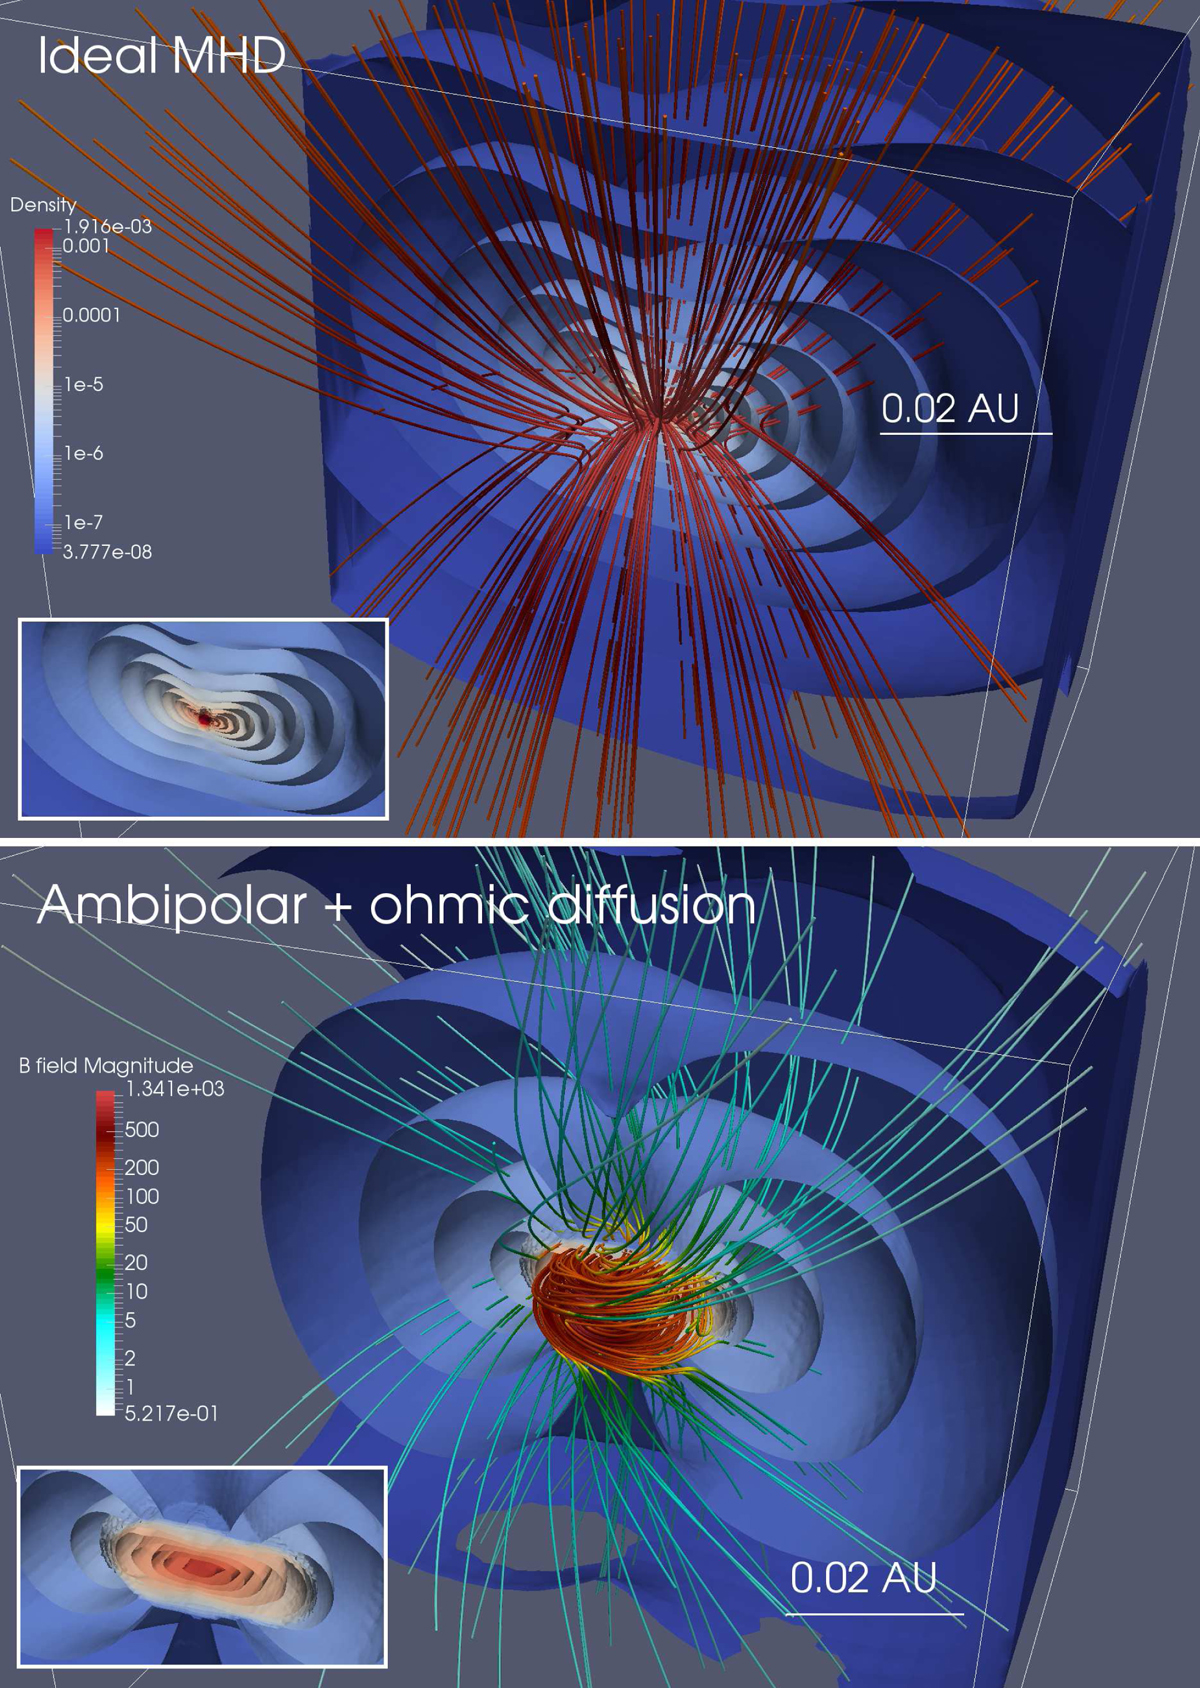
3D visualization of logarithmically spaced density isosurfaces in the inner-most region of the computational domain showing the structure of the second Larson core, in the case of ideal (top) and non-ideal (bottom) MHD. The isosurfaces have been cut half-way in the x-direction. The magnetic field lines are overlayed and have been coloured according to the magnitude of the magnetic field vector. The insets in the lower left corner of each panel show (with the same spatial scale) the central region of the system without the B field for a better view of the morphology. The density and magnetic field colour scales apply to both panels.
Current usage metrics show cumulative count of Article Views (full-text article views including HTML views, PDF and ePub downloads, according to the available data) and Abstracts Views on Vision4Press platform.
Data correspond to usage on the plateform after 2015. The current usage metrics is available 48-96 hours after online publication and is updated daily on week days.
Initial download of the metrics may take a while.