Fig. 3.
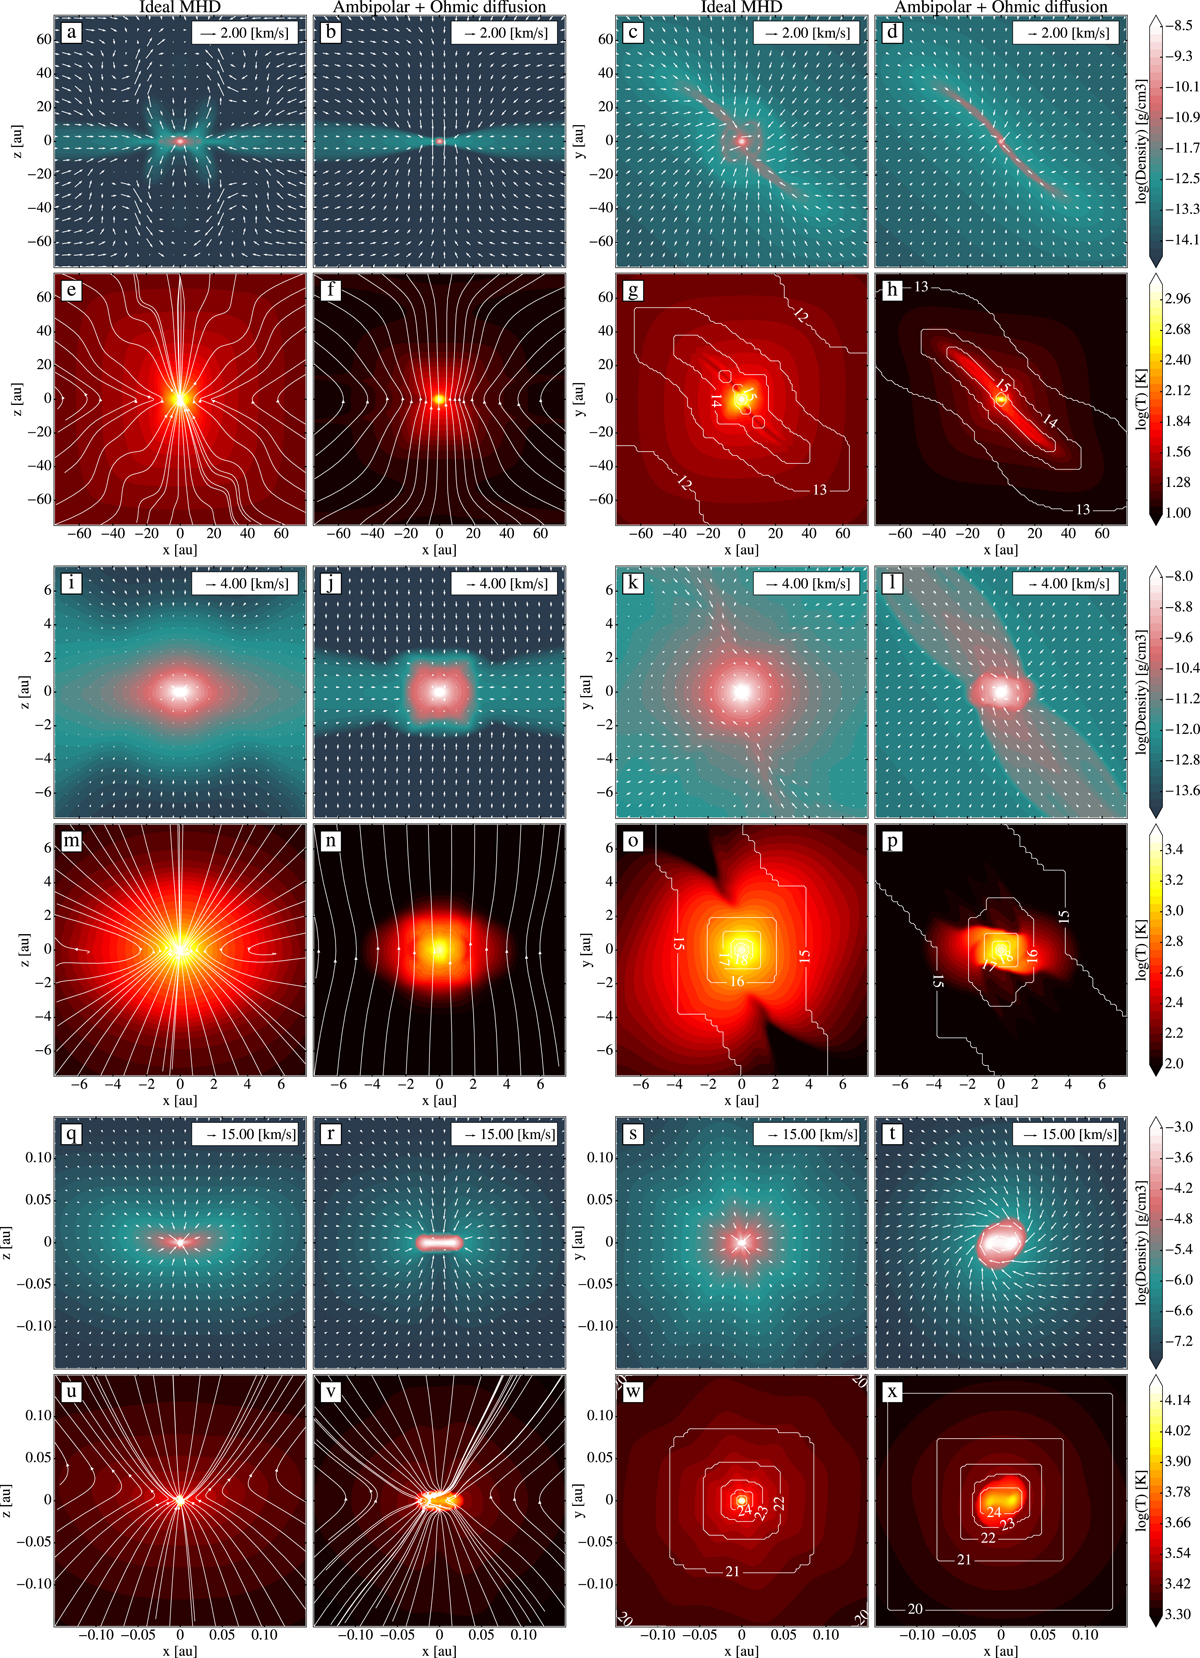
Slices through the centre of the domain, comparing the morphologies of the protostellar system in runID (columns 1 and 3) and runAO (columns 2 and 4) on three different spatial scales at the epoch of second core formation. Panels a–h: display a wide region around the first Larson core, the typical scale of a protoplanetary disk. Panels i–p: immediate vicinity of the first Larson core. Panels q–x: present the second Larson core and its close surroundings. Two left columns: side x–z views of the system, while the two right columns display the top x–y perspective. The coloured maps in each row alternate between representing the gas density and temperature. The arrows on the density maps depict the gas velocity field. Overlayed onto the temperature maps are magnetic field lines (left column) and AMR level contours (right column).
Current usage metrics show cumulative count of Article Views (full-text article views including HTML views, PDF and ePub downloads, according to the available data) and Abstracts Views on Vision4Press platform.
Data correspond to usage on the plateform after 2015. The current usage metrics is available 48-96 hours after online publication and is updated daily on week days.
Initial download of the metrics may take a while.