Fig. 2.
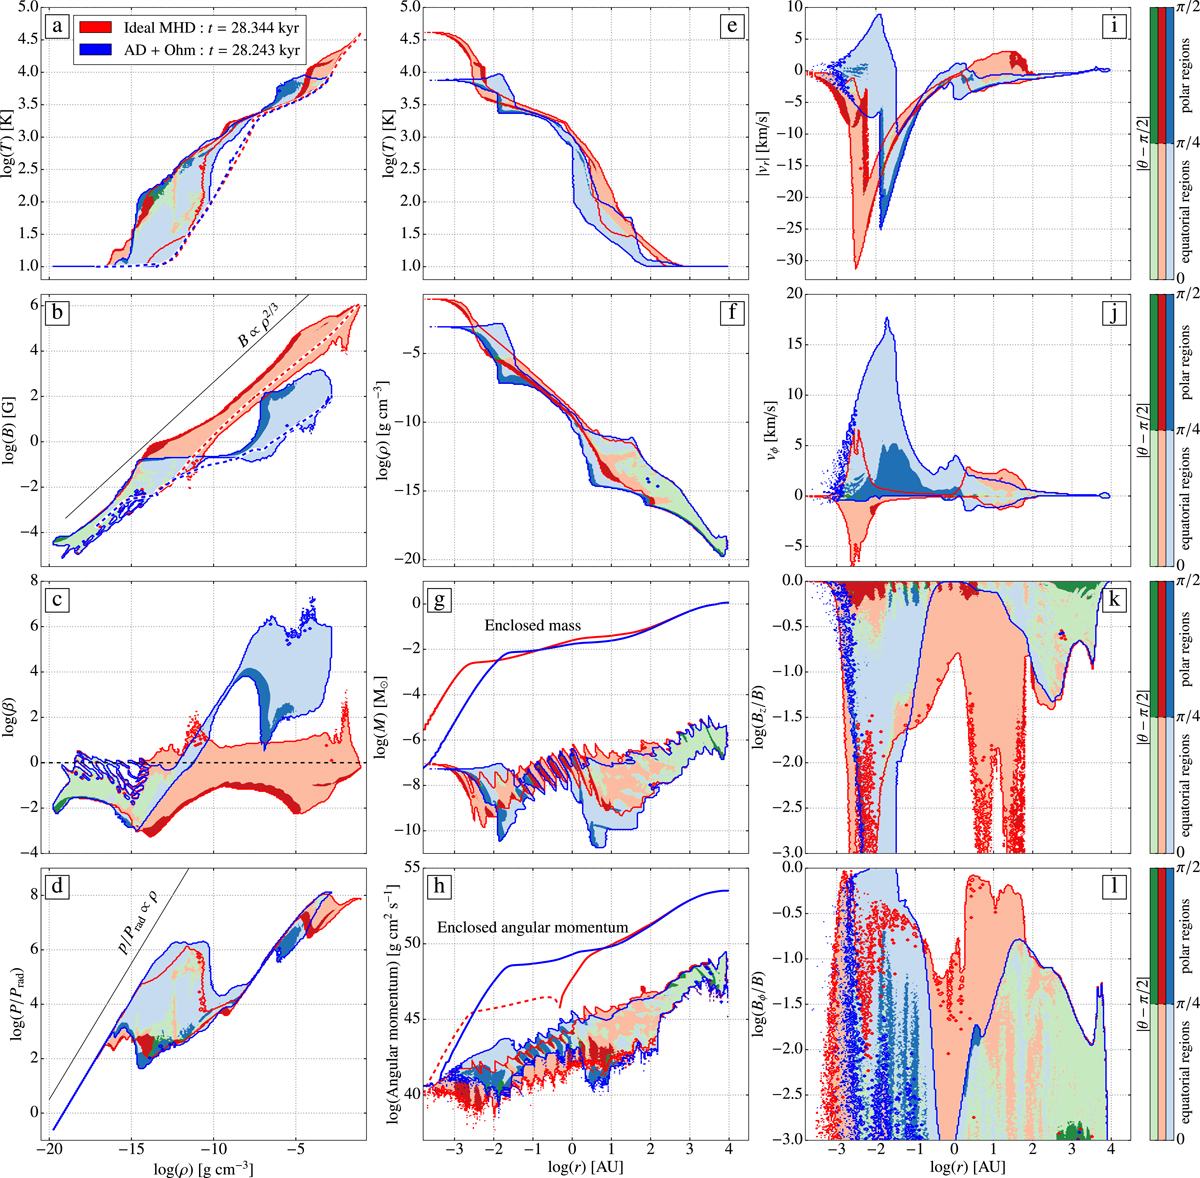
Left column: temperature (panel a), magnetic field (panel b), plasma β(panel c), and ratio of thermal to radiative pressure (panel d) as a function of density, for every cell in the computational domain at the epoch of second core formation. The IMHD simulation is represented by the red colours, while the blue shades are for the NIMHD run. The green colours correspond to areas where IMHD and NIMHD results agree within 10%. Each data set is delineated by a solid contour line which outlines the data distributions. The dark and light colours give an indication of the positions of the cells in the simulation box according to the θ = cos−1(z/r) angle: the light colours denote cells close to the equatorial region (π/4 < θ < 3π/4) while dark colours show cells in the polar regions (θ < π/4 or θ > 3π/4). The dashed lines in panels a and b represent the time evolution of the central (densest) cell inside the mesh. The thin black line in panel b is the power law predicted from magnetic flux conservation in a contracting gas sphere. Center and right columns: radial distributions of various quantities for every cell in the computational domain. As in the left column, red colours are for runID while blue colours are for runAO. In panels g and h additional lines show the integrated enclosed mass and angular momentum, respectively, in successive spherical shells going outward from the centre of the system.
Current usage metrics show cumulative count of Article Views (full-text article views including HTML views, PDF and ePub downloads, according to the available data) and Abstracts Views on Vision4Press platform.
Data correspond to usage on the plateform after 2015. The current usage metrics is available 48-96 hours after online publication and is updated daily on week days.
Initial download of the metrics may take a while.