Fig. E.1.
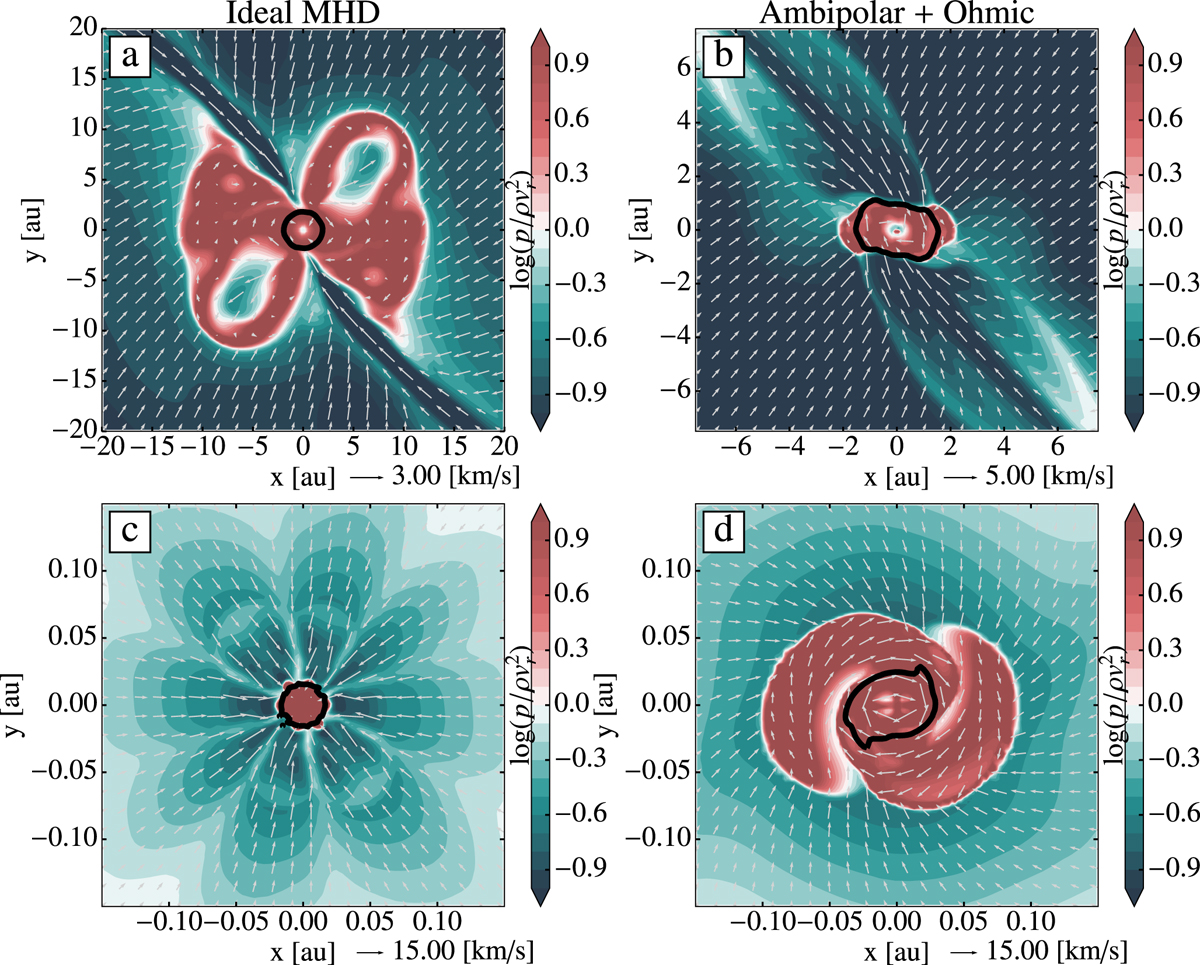
Maps and contours showing the morphologies of the cores using two different definitions. The coloured maps show the ratio of thermal to infalling ram (kinetic) pressure, while the black solid contour defines the region where the gas density exceeds density thresholds of ρcore = 10−10 g cm−3 for the first Larson core and ρcore = 10−5 g cm−3 for the second Larson core. The panels are: (a) runID first core, (b) runAO first core, (c) runID second core, (d) runID second core. We note the difference in spatial scales between panels a and b.
Current usage metrics show cumulative count of Article Views (full-text article views including HTML views, PDF and ePub downloads, according to the available data) and Abstracts Views on Vision4Press platform.
Data correspond to usage on the plateform after 2015. The current usage metrics is available 48-96 hours after online publication and is updated daily on week days.
Initial download of the metrics may take a while.